For years, business intelligence (BI) has been shorthand for static dashboards, monthly reports, and siloed performance snapshots. But that definition no longer fits. BI today is shifting from passive reporting to active insight delivery — powered by real-time data, embedded workflows, and AI-driven analysis. It’s less about what you can see and more about what you can act on.
Modern BI is not a dashboard. It’s a capability. One that helps decision-makers move faster, align operations, and transform raw data into meaningful insights that drive performance. The organisations that treat BI as a living part of their architecture — not just a presentation layer — are pulling ahead in agility, accuracy, and execution.
With the business intelligence market projected to exceed $116 billion by 2033 and cloud-based BI accounting for over half of all deployments in 2024, the direction of travel is clear. This is no longer a tool for analysts. It’s a strategic function embedded across the enterprise.
To understand what that looks like, you need to start with what business intelligence really is — and what it should be doing for your business today.

Understanding the True Role of Business Intelligence Today
Business intelligence has evolved beyond reports and dashboards. Today, it functions as a cross-functional capability stack — integrating data, generating insight, and supporting decisions in real time, at scale.
Where BI was once used to explain what happened, it’s now being used to predict what could happen and guide what to do next. It’s not just about observing patterns. It’s about orchestrating action.
That evolution starts with how BI systems work. They bring together disparate data sources, clean and transform them, and deliver meaningful outputs that can be used across business operations — from finance and sales to supply chain and customer success. These aren’t static views of yesterday's performance. They’re dynamic models of what needs to happen now.
And today’s best BI platforms don’t just display those models — they respond to the moment. Advanced analytics turns BI into a live operational partner. Embedded workflows push insights directly into day-to-day tools, while streaming data from CRM, ERP, IoT, and supply chain platforms ensures decisions are made using what’s happening now, not what happened last quarter.
The business case is clear. According to a recent industry report, 80 per cent of organisations have seen their revenues increase as a direct result of using real-time data. This isn’t just a technical upgrade. It’s a measurable shift in how businesses create value — where BI becomes an always-on capability woven into the way work gets done.
It’s also important to distinguish business intelligence from business analytics. While they’re often used interchangeably, BI focuses on descriptive and diagnostic insight — what is happening and why — while analytics leans more into prediction and prescription. The difference matters, especially as more organisations invest in AI and automation to provide insights without human prompting.

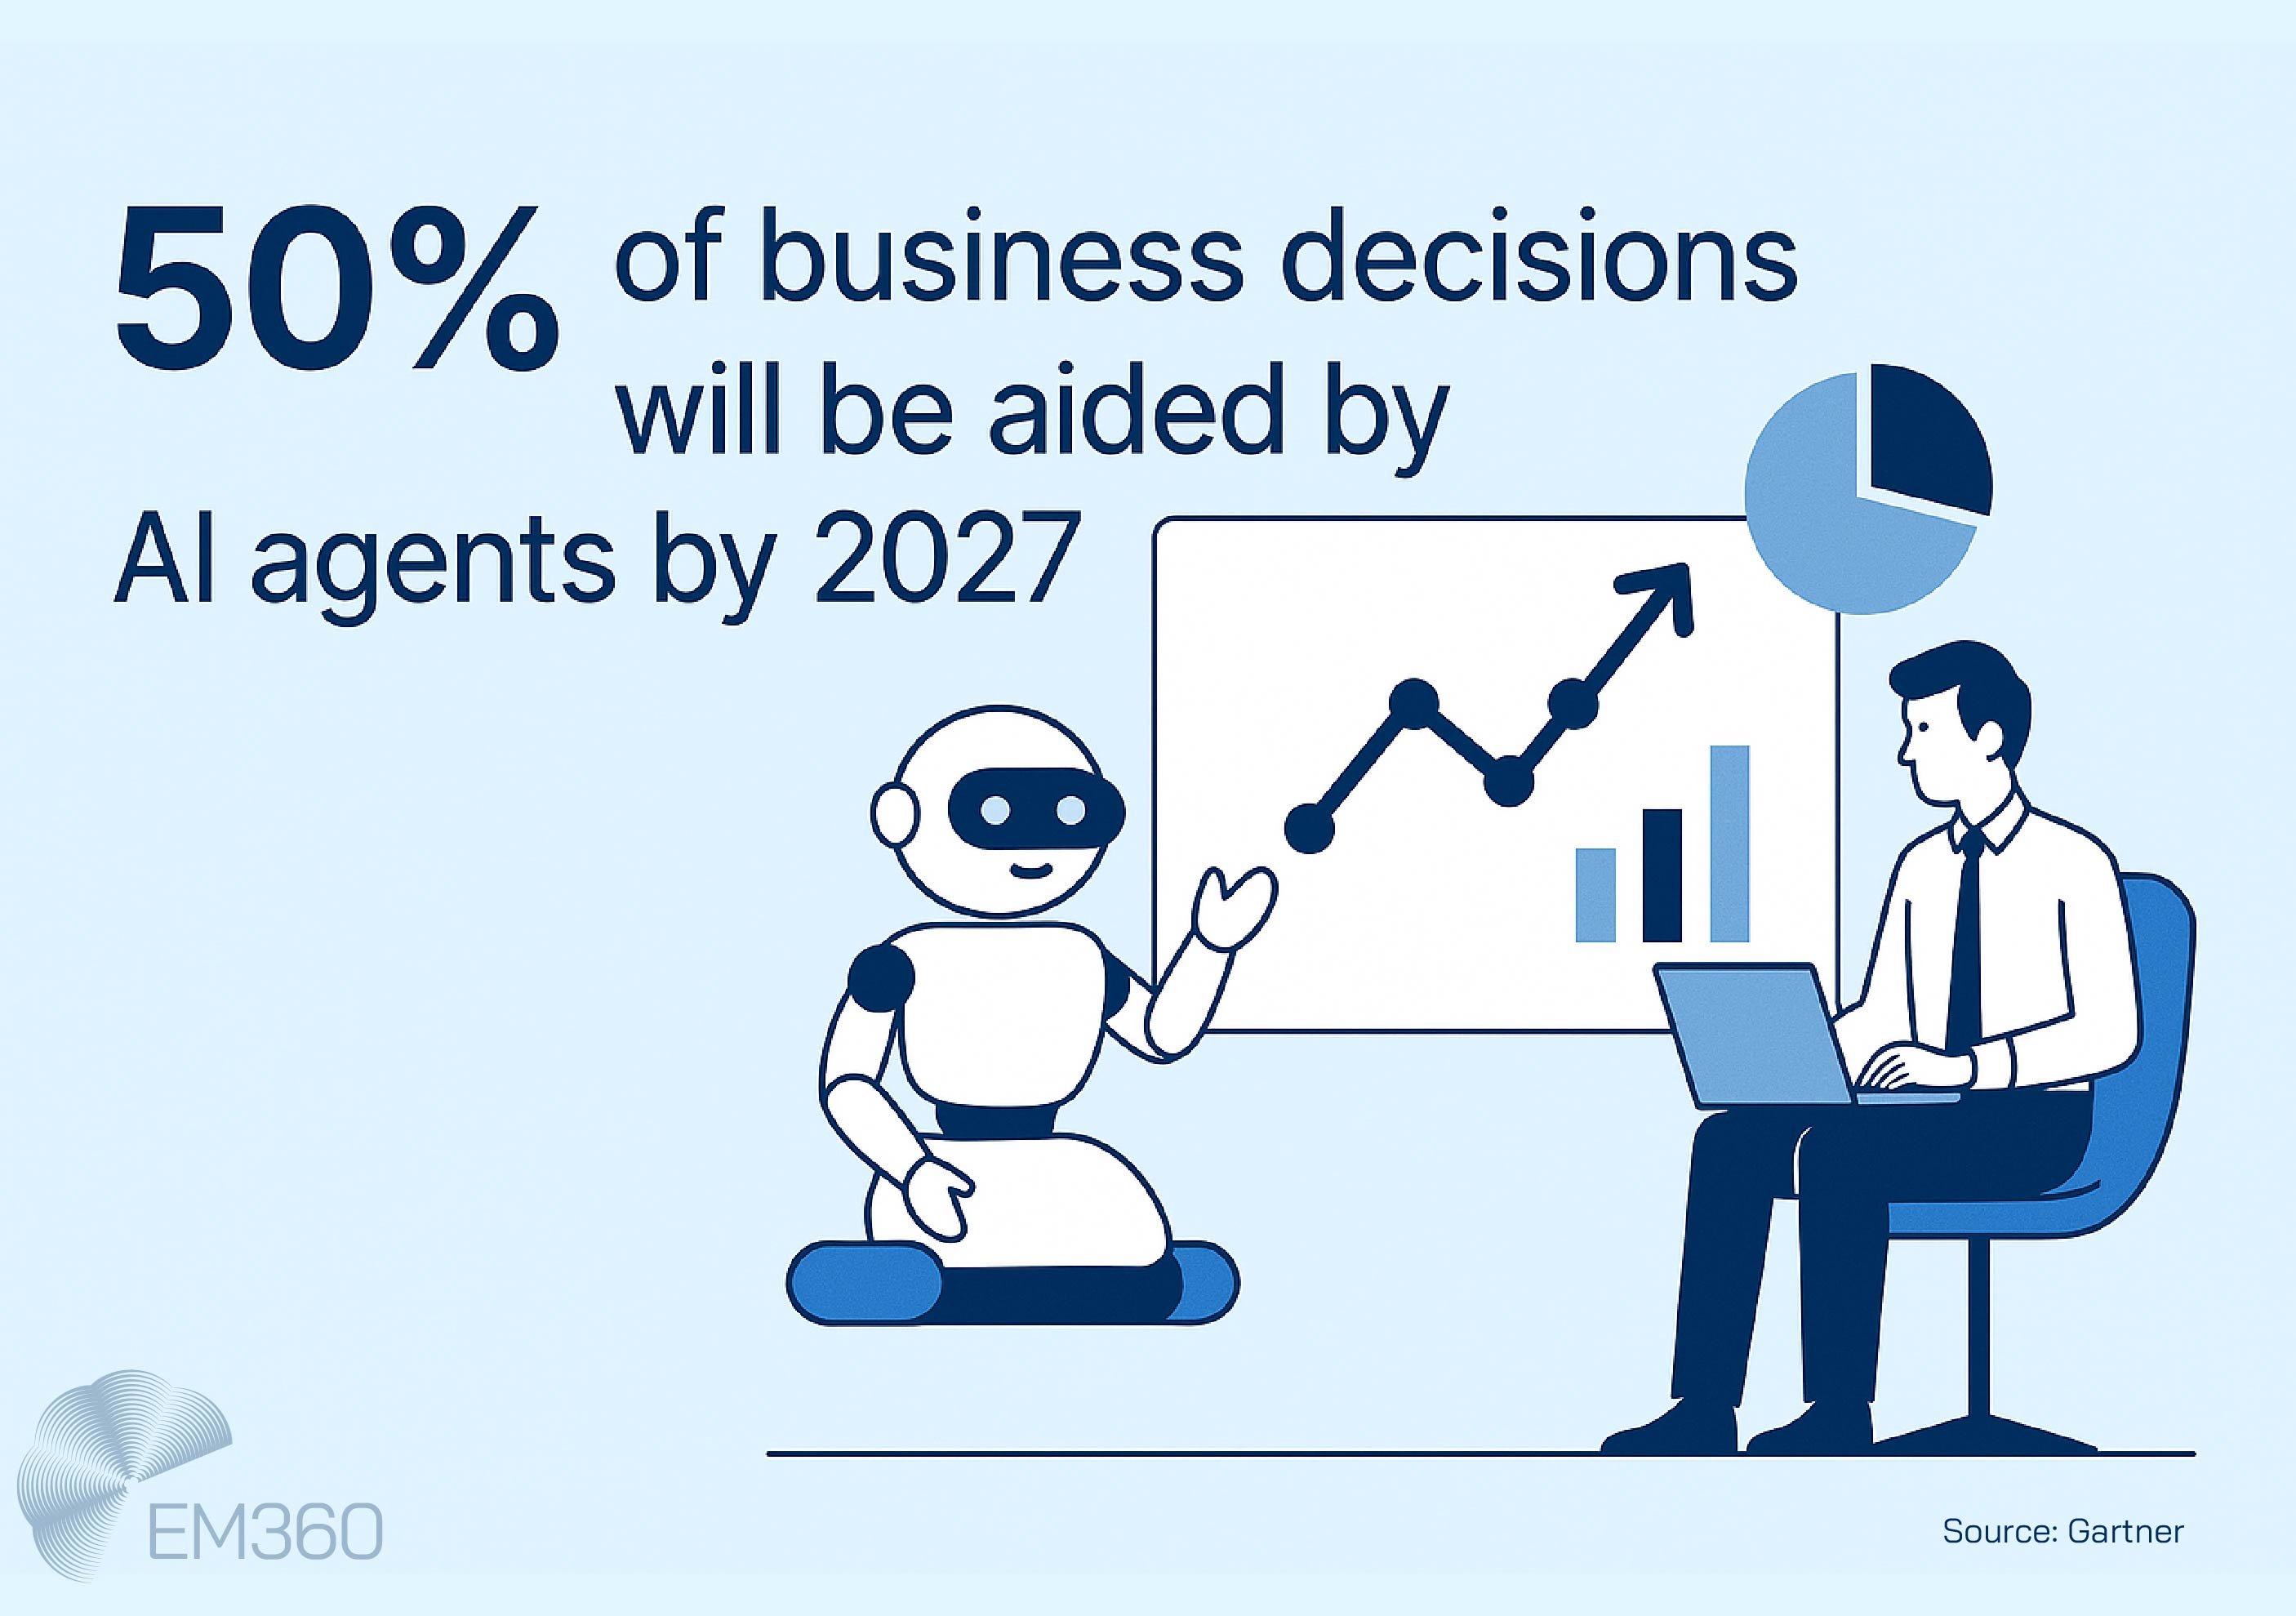
During Gartner’s 2025 Data & Analytics Summit, it was projected that 50 per cent of business decisions will be augmented by AI agents for decision intelligence by 2027. That means enterprise BI isn’t just evolving — it’s becoming essential infrastructure for every department.
Core Components of Modern BI Platforms
To move from dashboards to decision support, BI platforms need more than visual polish. They need flexible, integrated architecture that can handle fast-moving data, diverse user needs, and ever-increasing complexity.
From data integration to decision
Every BI system begins with data. It’s pulled from systems like CRMs, ERPs, IoT sensors, and APIs — then cleaned, transformed, and prepared through ETL processes.
Once ready, it’s stored in a data warehouse, data lake, or increasingly, a data lakehouse. This hybrid infrastructure supports both immediate insights and deep historical context — without duplicating infrastructure or slowing access.
What happens next turns data into business value. Models, governance frameworks, and context layers are applied to make insight trustworthy and usable. When done well, the result is a system that supports confident, insight-led decisions across the organisation — not just better reports.
Embedded, self-service, and AI-augmented features
Today’s BI isn’t accessed on a dashboard. It’s embedded in workflows.
From sales and support platforms to supply chain tools, embedded analytics reduce context switching and let team members act when the insight matters most. Self-service BI empowers business users to explore data independently, eliminating bottlenecks and expanding adoption.
And now, AI-augmented analytics is raising expectations. Tools like AWS’s upcoming Q Business Suite let users ask natural language questions, generate insights, and explore recommendations without writing a single query. From predictive analytics models to GenAI copilots, these features are changing how teams engage with data — and what they expect from BI.
These capabilities aren’t emerging trends. They’re fast becoming table stakes for any enterprise-ready platform.
BI in Action Across the Enterprise
The value of business intelligence doesn’t come from central reports. It comes from how insight travels through the organisation — into the decisions, tools, and day-to-day actions of every team.
Across finance, operations, marketing, and supply chain, BI is helping teams move faster, respond smarter, and perform with greater precision.
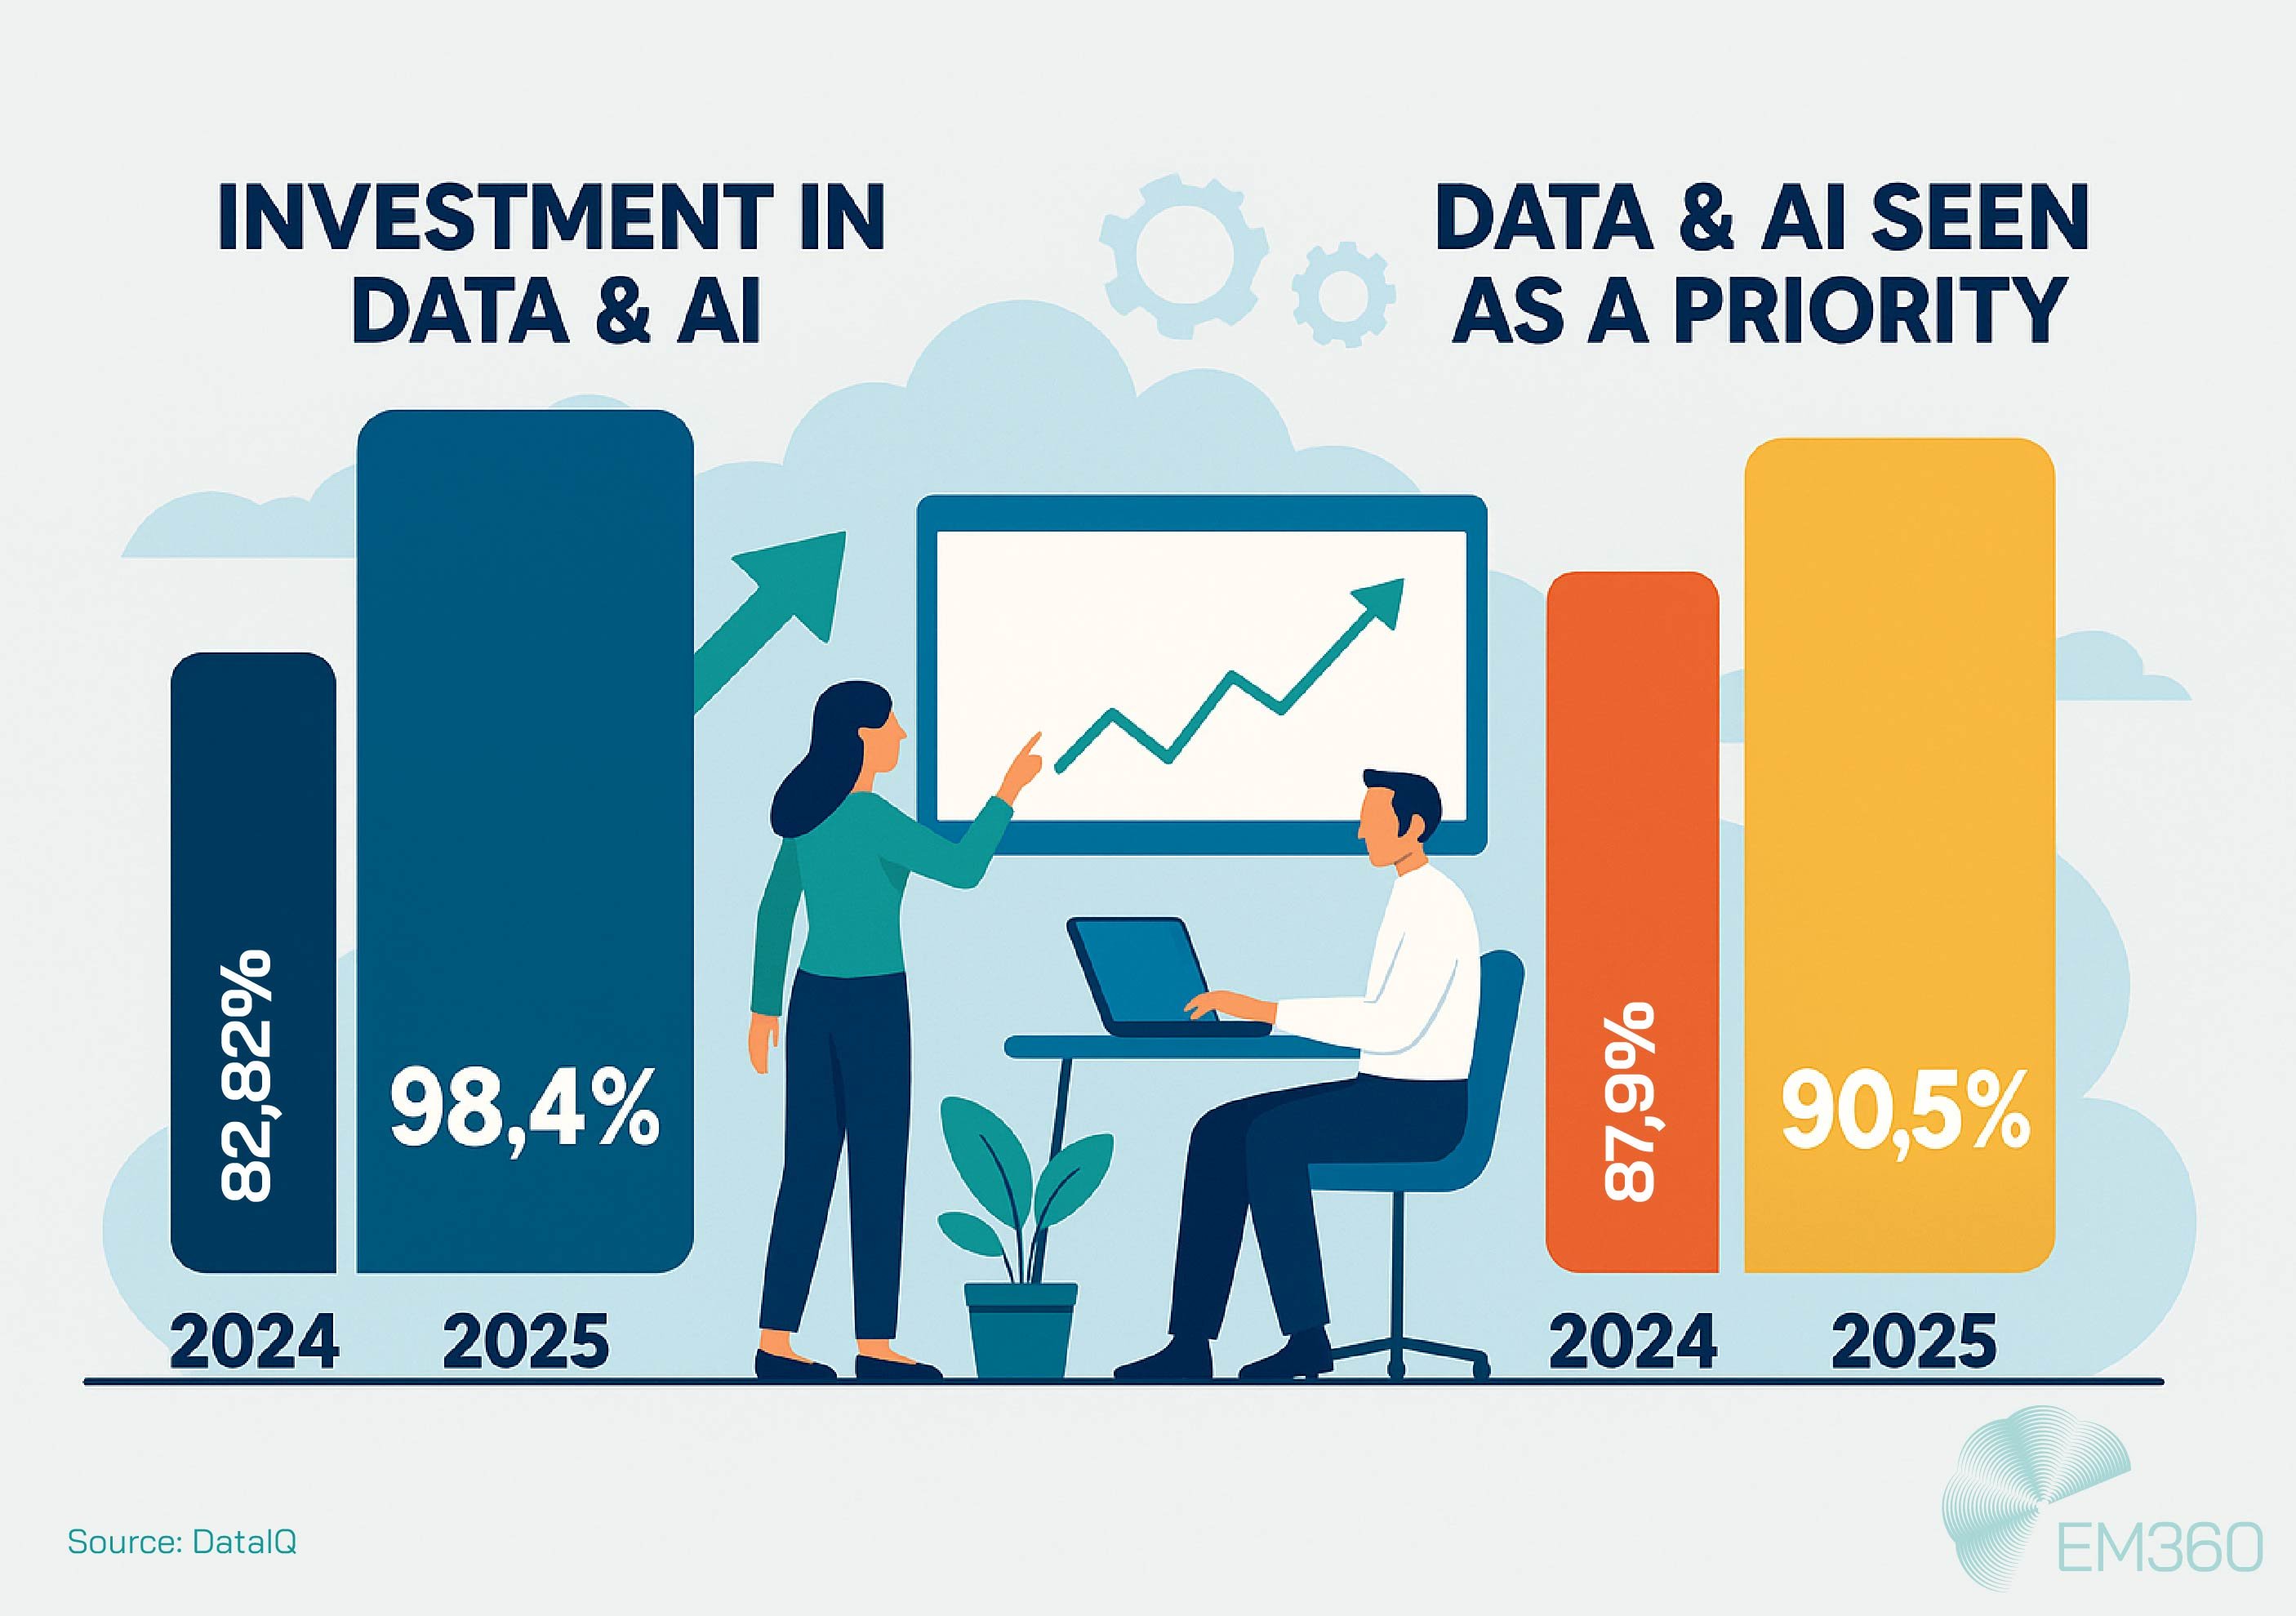
Enterprise investment in data and AI reflects this shift. Recent benchmark research shows that investment in these initiatives jumped from 82.2 per cent in 2024 to 98.4 per cent in 2025. More tellingly, the percentage of leaders naming it a top organisational priority rose from 87.9 to 90.5 per cent in just one year.

The message is clear: BI isn’t just a reporting function. It’s a performance engine.
Finance
Finance teams are using BI to shift from static planning to responsive forecasting. With access to near-real-time financial data, they can monitor cash flow, model risks, and run scenario analyses as conditions change — without waiting for quarterly reviews.
This kind of visibility supports faster decisions around capital allocation, vendor negotiations, and strategic investment. It’s no longer just about balancing the books. It’s about leading with financial foresight.
Operations
In operations, BI is reducing delays, cutting waste, and improving consistency. Whether it’s manufacturing output, field service SLAs, or logistics performance, teams now have a clear view of what’s happening — and where to intervene at any moment.
This supports more adaptive resourcing, better demand planning, and faster issue resolution. With fewer surprises and more signal, operational efficiency becomes an everyday outcome, not an annual target.
Marketing
BI has become essential for marketing teams to understand customer behaviour in context. Instead of optimising after the fact, they can now track campaign performance as it unfolds — adjusting spend, messaging, and channels in the moment.
Behavioural analytics tools and audience insights help teams personalise outreach and improve ROI. In a space where timing and relevance make all the difference, this kind of responsiveness is a competitive edge.
Retail and Supply Chain
BI is transforming supply chains from reactive to predictive. By unifying logistics data, supplier metrics, and store performance into a single view, teams can anticipate stockouts, reroute shipments, and rebalance inventory before issues escalate.
That visibility helps reduce waste, cut costs, and keep operations moving — especially in volatile markets where every delay or surplus impacts margin. In retail, BI also supports smarter merchandising, dynamic pricing, and customer experience optimisation at the point of sale.
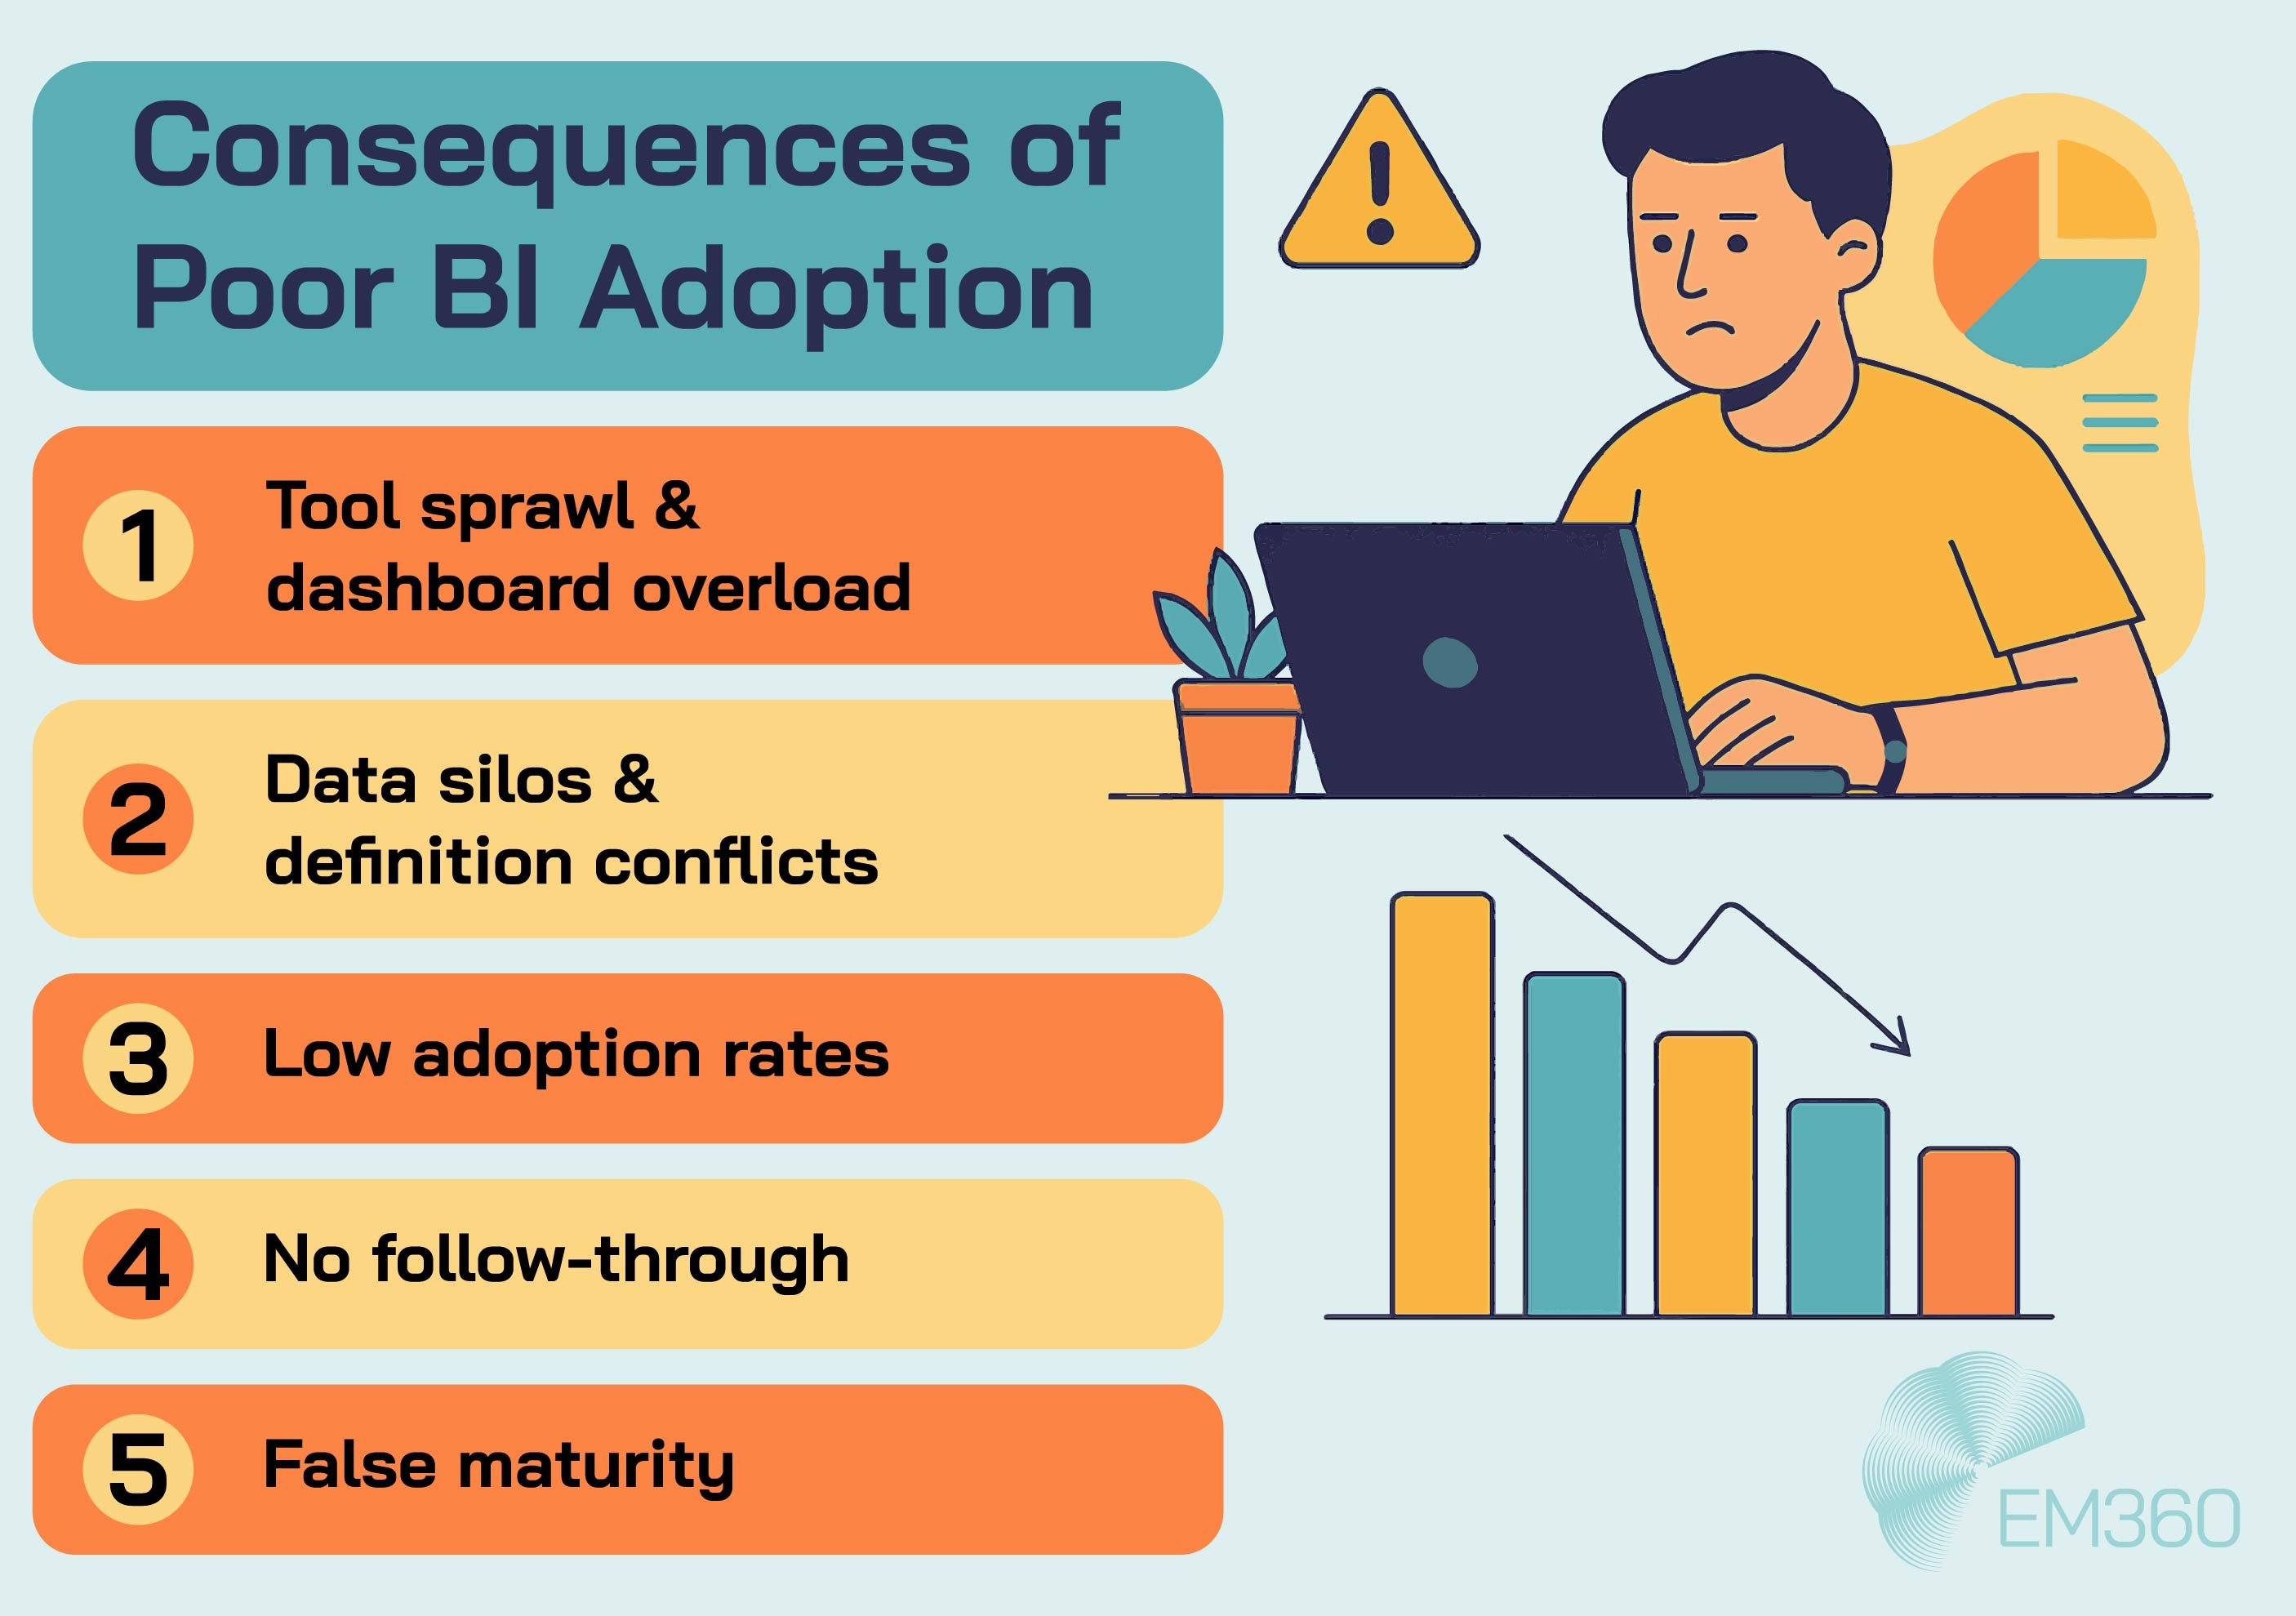
The Hidden Cost of Poor BI Adoption
Even with the right tools in place, business intelligence can fail to deliver. The gap between implementation and impact often comes down to how BI is governed, adopted, and embedded. Decision-making, performance, and trust all suffer when those elements fall short.
Here’s what that failure can look like in practice.
BI tool sprawl and dashboard overload
It starts with good intentions. One team adopts a new BI platform, another builds custom reports, and a third runs dashboards in a separate tool. Over time, this creates a fragmented landscape of overlapping features, inconsistent insights, and avoidable licensing costs.
Instead of one shared system of insight, the business ends up with dozens of dashboards — none of which drive confident action.
Siloed data and inconsistent definitions
One of the most common blockers to BI maturity is the absence of a shared data language. Without agreed definitions or trusted metrics, teams work with conflicting numbers that erode trust and slow decisions.
A dashboard may show growth, while another signals decline. That’s not a visibility issue. It’s a governance issue.
Low adoption among business users
If a BI platform isn’t intuitive, useful, or clearly relevant, people won’t use it. When data teams' needs, not business users' decisions, shape the development of tools, adoption falters.
Too many clicks. No context. Hard-to-navigate filters. These are the friction points that turn a strategic system into shelfware.

Lack of follow-through
Even when BI surfaces useful insights, they often fail to spark action. Reports circulate. Meetings happen. Nothing changes.
Insight without ownership is just noise. To close the gap between analysis and outcome, BI needs clear workflows, aligned accountability, and built-in follow-through.
The illusion of maturity
On the surface, everything might look polished — sleek dashboards, weekly metrics, animated graphs. But if the foundations are weak, decisions still rely on instinct, not insight.
This creates a dangerous illusion: the belief that BI is working when, in reality, it’s being bypassed.
Governance, Trust, and the Cultural Shift
Avoiding those pitfalls isn’t about adding another tool. It’s about building the right conditions for BI to work — where data is aligned, insight is trusted, and action is possible.
That starts with governance. And it’s reinforced by culture.
What effective BI governance looks like
When definitions conflict or models aren’t aligned, insight becomes noise. Governance ensures that teams aren’t just using the same tools — they’re working from the same foundation.
That means:
- Clear definitions for key metrics
- Role-based access and auditability
- Quality checks on source data
- Standardised terminology across teams
These aren’t backend concerns. They shape how decisions get made, how fast they happen, and whether people trust the data in front of them.
Strong governance prevents BI from becoming fragmented. It aligns tools, teams, and processes — so insight is scalable, consistent, and ready to support real decisions.
Building a data-driven culture
Governance makes insight possible. Culture makes it stick.
Even the most intuitive BI platforms fail when teams don’t trust the data or don’t see how it connects to their goals. That resistance is rarely technical. It’s emotional. It’s behavioural.
Solving it requires:
- Visible sponsorship from leadership
- Hands-on enablement for business users
- Collaboration between data and domain experts
- Continuous reinforcement of how insight drives outcomes
When teams are confident in the data — and confident acting on it — BI becomes a habit, not a hurdle.
Final Thoughts: Business Intelligence Must Become a Strategic Capability
Business intelligence isn’t a tool. It’s a capability — and one that’s now critical to enterprise performance. The organisations getting the most value from BI aren’t the ones with the most dashboards. They’re the ones delivering fewer, smarter insights that are timely, trusted, and tied to real decisions.
That shift requires more than new technology. It calls for architectural clarity, cross-functional access, and a culture that treats insight as infrastructure. It means moving from reports to real-time signals, from passive analysis to continuous intelligence, and from department-led projects to enterprise-wide strategy.
For data leaders, the question is no longer, “What platform should we use?” It’s:
- Are our insights embedded where decisions happen?
- Can our teams trust and act on the data they see?
- Do we have the architecture in place to support what’s next?
These are the hallmarks of BI maturity — not visual polish, but operational relevance.
As business expectations continue to shift and data ecosystems grow more complex, one thing remains clear: the value of BI will come down to how well it is woven into the way decisions are made.
To explore how your BI strategy compares, or to benchmark your data capabilities, visit EM360Tech’s latest reports and expert-led podcast sessions.


Comments ( 0 )