Modern Healthcare Diagnostic Testing & Monitoring
Top 10 Software Observability Tools for 2024

As organisations turn to cloud-native architectures and microservices to build and deploy their applications, gaining visibility into IT infrastructure has never been more important.
Enterprises all over the world are becoming increasingly reliant on complex, distributed systems that require thousands of processes running on the cloud, on-premises or both to trace and keep track of.
When these systems don’t work as they should, it can be difficult for IT teams to find a solution if they don’t have access to the data required to find the source of the problem. So how can you keep an eye on your cloud infrastructure to make sure everything is running as it should?
That’s where observability tools come in.
What is software observability?
Software observability is the ability to measure your system’s current state based on the data it generates, such as logs, metrics, and traces. It relies on telemetry data from instrumentation from the endpoints and services in your multi-cloud environments. In these environments, every hardware, software, cloud infrastructure component, container, tool, and microservice generates data for every activity.
The goal of observability is to use this data to understand what’s happening across all these environments and among the technologies, so you can identify and resolve issues and keep your systems running as efficiently as possible.
Organisations typically do this using a combination of instrumentation methods including open-source instrumentation tools, such as OpenTelemetry. Many also adopt an observability tool to help them detect and analyse the significance of events to their operations.
What are software observability tools?
Software observability tools are cloud-native software applications designed to help organisations monitor, troubleshoot, and improve the performance of their cloud systems and applications
Unlike traditional monitoring tools, observability tools give businesses constant insight into their systems, providing continuous feedback on their performance, efficiency and behaviour.
This allows organisations to quickly identify and resolve application performance issues even when they occur in different parts of the system in their cloud environment.
Features of software observability tools
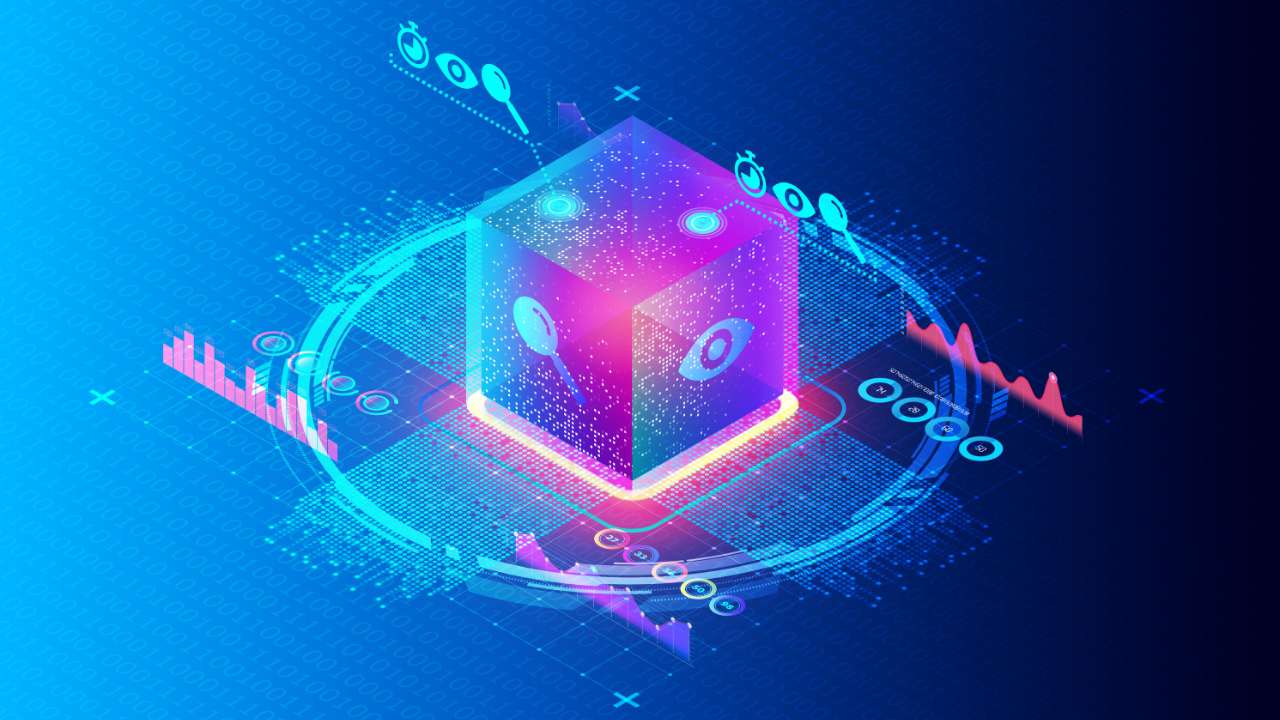
While the main features of observability tools can vary from tool to tool, most tools come with a set number of features to help you stay on top of your applications in the cloud.
Some of the most common features of cloud-native observability tools include:
- Distributed tracing: Distributed tracing is the ability to track a single request as it flows through a distributed system, even if the request crosses multiple containers or microservices. This is essential for troubleshooting problems in cloud-native applications, which are often complex and distributed.
- Service discovery: Service discovery is the ability to automatically discover all of the services in a cloud-native application. This is important because cloud-native applications can be dynamic and change frequently.
- Real-time monitoring: Real-time monitoring is the ability to monitor cloud-native applications in real-time. This is essential for identifying and resolving problems quickly.
- Alerting: Alerting is the ability to generate alerts when problems are detected. This allows organizations to be notified of problems quickly so that they can take corrective action.
- Dashboarding: Dashboarding is the ability to visualize data from cloud-native applications in dashboards. This makes it easy to identify trends and patterns in the data.
Choosing a software observability Tool
Choosing the best observability tool for your organisation can be daunting. You need to consider several different factors, including your specific needs, budget, and technical expertise.
Here's a step-by-step guide to help you make a decision:
1. Define your data observability goals
What do you hope to achieve with data observability? Are you primarily focused on improving data quality, identifying data pipeline issues, or enhancing data security? Clearly define your goals to narrow down your options and choose a tool that aligns with your priorities.
2. Assess your data
Understand the types of data you generate, the sources of that data, and the tools and technologies you use to manage it. This will help you determine the compatibility and integration capabilities of potential data observability tools.
3. Evaluate key features and capabilities
Consider the features and capabilities that are most important to you. Some essential features include data profiling, anomaly detection, root cause analysis, real-time monitoring, and alerting. Prioritise features that address your specific needs and challenges.
4. Consider ease of use and integration
Choose a tool that is easy to use and integrate with your existing data infrastructure and tools. This will minimize the disruption to your workflow and ensure a smooth transition to data observability.
5. Evaluate pricing and scalability
Data observability tools vary in pricing models and scalability options. Consider your budget and growth plans to choose a tool that fits your financial constraints and can accommodate your future data volume and complexity.
Best observability tools
There are a variety of different cloud-native observability platforms on the market today, each with its own benefits, price points and features.
Here are our picks for ten of the best cloud-native observability tools available today to help you choose the best tool to make the most of your applications.
SolarWinds
A SaaS solution designed to extend visibility across cloud-native, on-prem, and hybrid technology stack, SolarWinds is a powerful observability platform for organisations looking to take back control of managing their applications. The platform gives comprehensive, single-pane-of-glass visibility with actional intelligence by eliminating tools sprawl so that your developers can focus on building and deploying applications. And if issues crop up, Solawinds resolves them rapidly using its built-in AI-ops intelligence and actionable insights driven by data from across the environment to find a solution.
SolarWinds Observability is designed to provide you with maximum flexibility and choice. The platform combines application performance metrics with distributed tracing and log monitoring capabilities along with AIOps-driven notifications and supports a host of cloud-native open-source frameworks and third-party integrations. Its Integration with AI-powered analytics and application and log observability allows you to deliver context-rich intelligence to help you proactively identify and resolve performance issues.
Sumo Logic
Sumo Logic’s cloud-native observability tool provides coverage across all of your data on a highly scalable, secure, cost-effective analytics platform. The unified platform drives insights through logs and metrics to help customers deliver reliable and secure applications while reducing downtime and solving observability issues seamlessly across the cloud. Its automated anomaly detection can identify the root cause of application issues in seconds, leveraging machine learning to help companies go from identifying components experiencing an anomaly to the root cause of the problem. If any issues slip through the they’re quickly picked up by Sumo Logic’s service map feature, which seamlessly diagnoses anomalies by visualising the service dependencies and drilling down to their associated traces and infrastructure.
With Sumo Logic, you don’t have to worry about getting set up. The platform greatly reduces monitoring setup time by proactively discovering new services and infrastructure as it is deployed, displaying actional data in pre-configured dashboards and automatically configured alerts. Once you’re set up, it's easy to gain visibility in your cloud applications. You can navigate through the entire application stack and an extensive catalogue of preconfigured solutions, and quickly add new components for complete visibility all in the same platform. This makes it easy to manage your applications effectively and take action when things go wrong.
Grafana Cloud
Grafana Cloud is a fully managed cloud-native observability platform built to help you gain visibility across your cloud environments. The platform’s open and composable architecture gives you the flexibility to host your metrics, logs, and traces and mix and match tools to avoid vendor-lock-in. It seamlessly integrates all of the best open-source technologies into a curated observability platform that is completely managed and scaled by the Grafana team so you can focus on more important tasks. Whether you want to monitor popular infrastructure components such as MySQL, Postgres, and Redis or gather important metrics, logs, or traces, Garafa Cloud provides all the tools you need to manage your applications all in one place.
Grafana’s joint project with Prometheus open-source projects are de facto standards for observability, with wide grassroots adoption. Both are easy to get started with and to use. But it can take weeks to get the best out of a complete integrated stack — including logs, traces, an agent, dashboards, and alerts – and not every organization has the time and resources to do this.
LogicMonitor Envision
Logic Monitor’s Envision is an innovative observability platform that gives you clarity across your data centre environments and public clouds with actionable insights across SaaS, and cloud-native applications. The platform quickly identifies and resolves performance issues in the cloud, leveraging AIOps to spot performance trends and shift their time and investment from operational tasks to work that drives innovation for the enterprise. It also combines the collection, analysis, contextualization and exploration of observability data across traditional and modern environments to remove blind spots from siloed monitoring tools and act as a single source of truth for your IT teams.
The LM Envision platform also helps with h IT-business alignment by correlating IT metrics with business metrics by adding the necessary data context within the IT data supply chain. Its Push Metrics API means you can bring in data from nearly any system in LogicMonitor, which you can use to add business dashboards and reports. Its OpenTelemtry feature allows you to also incorporate business context directly into your microservices to correlate traces to the health-specific services or applications.
AppDynamics
Powered by Cisco, the AppDynanics cloud-native observability platform helps organisations deliver l user experiences that turn performance into profit. Providing users with a looking-glass into application behaviour, the platform aligns full-stack performance with key business metrics like conversions and quickly resolves issues before they impact the bottom line. This is thanks to Appdynamic’s incredible Business Journey Mapping feature, which surfaces contextual insights showing how performance impacts your operations and automatically captures errors, crashes, network requests, page load details and other metrics for an entire user session.
Visualising these metrics is easy too. With Appdynamic’s user journey dashboards you can visualise key performance metrics across user conversion or other milestones in the customer journey, giving you insights into the impact on your business when users abandon your application due to latency or other potential performance challenges.
Mezmo
Formerly LogDNA, Mezmo is an innovative log analysis platform designed to simplify the management of DevOps Telemetry Data to surface insights and reduce observability costs. Its powerful telemetry pipeline solution transforms machine data into actional insights to provide comprehensive visibility into distributed systems and microservices to improve operational efficiency, reduce downtime, and enhance customer experience by providing timely and actionable insights into their systems.
Mezmo makes it easy to take control of crucial data to building and maintaining cloud systems and applications. You can profile event patterns, suggest pre-configured Recipes to dramatically cut costs, and offer Responsive Pipelines to accelerate incident response times. It has also recently added more integrations with more data sources to the Telemetry Pipeline platform, along with controls that make it simpler to optimize data storage and usage. For example, an Events-to-Metrics Processor capability identifies and extracts metrics from logs to make them easier for third-party tools to consume.
Honeycomb
A leader in the 2023 Gartner Magic Quadrant for Observability and APM. Honeycomb provides all the tools you need to keep your applications running smoothly in complex, distributed systems. The platform’s full-stack observability is specially designed to handle high cardinality data and collaborative problem solving, enabling engineers to deeply understand and debug production software together and seamlessly interpret the billions of rows of data. Its unique datastore enables your developers to hone in on problems before your users discover them, organising telemetry data for fast, accurate exploration from the same UI – regardless of data type.
With fast software development feedback loops and real-time reality checks on how your code behaves and performs, Honeycomb takes the stress out of developing and deploying applications so that you can ship features reliably and solve issues faster. When you deploy your code, the platform gives you instant feedback on how your new feature is performing and ways it can improve, connecting your developers to your customers through real user experiences based on as many dimensions and rich contexts as you’d like to be able to analyse. When problems crop up, Honeycomb’s Service Level Objectives (SLOs) alert you to the most important user experience issues and are immediately debuggable using Honeycomb analysis workflow so you can isolate the problem. All of this in a single, cloud-native platform.
Dynatrace
Offering one of the industry’s best-in-class observability solutions, Dynatrace provides all the tools you need to keep tabs on your cloud environments and native applications. The platform makes monitoring cloud-native workloads and microservices a breeze, using OneAgent technology and open-source solutions like OpenTelemetry to automatically monitor dynamic microservice workloads running inside containers on Kubernetes. Its intuitive dashboards and user-friendly user face also make it easy to visualise how application dependencies impact application performance, giving you powerful insights into how application problems, security vulnerabilities, and SLO violations intersect.
Dynatrace acts as a full-stack, all-in-one solution to all your observability challenges, combining application performance monitoring, infrastructure monitoring and AIOps to keep tabs on cloud applications and microservices at all times. The platform combines log analytics with PurePath distributed tracing and the speed and scale of its AI analytics solution, Grail, to improve application resiliency and user experience across the cloud. This gives you on-demand, AI-powered answers to issues in even the largest and most dynamic environments.
Chronosphere
When it comes to taming cloud complexity, Chronosphere has you covered. The cloud-native observability platform is purpose-built for the speed, scale of complexity of modern cloud infrastructure and applications, providing you with all the tools you need to gain real-time insight into every layer of your stack and meet cloud performance and availability objectives. Chronosphere’s Control Plane gives you the power to shape and transform your observability data to fulfil your dashboard and alerting needs without having to store all the data in the raw form. The result is greatly reduced cost and improved performance across your cloud systems, giving you back control over your observability costs.
With Chronosphere, you have your telemetry data is at your fingertips. The platform breaks down silos between telemetry types by delivering correlated telemetry views, allowing developers to seamlessly navigate across all telemetry types without losing context. Unlike other entries on this list, Chronosphere is also 100% open-source compatible and supports proprietary data formats such as DogStatsD, SignalFx, and Wavefront. You can also collect your data using well-known open-source standards – including Prometheus and OpenTelemetry – so you never experience vendor lock-in.
New Relic
A leader in the Gartner Magic Quadrant for APM and Observability for the 11th time running, New Relic is an industry veteran when it comes to observability. The company’s cloud-native observability solution, Pathpoint, makes all data monitoring and security tools available in one connected observability experience, allowing you to collect crucial data about everything from system performance, transactions and customer experience in a single, unified platform. Navigating this data is a breeze too thanks to Pathpoints’ innovative, easy-to-use dashboards that all of your teams can use to implement alerts, notify the right teams and improve application performance.
With the ability to collect all telemetry with an open API and a single query language, New Relic allows your teams to new data sources and data types in one place. Pathpoint combines over 30 capabilities to enable engineers to understand dependencies across their stack and know where to focus to improve the quality of their service—removing data silos, eradicating tool sprawl, and offering rich insights for every engineer. New Relic’s plug-and-play third-party integrations ranging from CDN performance to customer experience bottom-of-funnel analysis help you analyse the impact of the health of your applications, networks, and infrastructure on business outcomes in a matter of minutes.


