

IT monitoring used to be about keeping the lights on. Now it’s about keeping the business moving. With hybrid stacks, distributed teams, and user expectations climbing fast, enterprises need more than visibility. They need insight they can act on.
At its core, IT monitoring is the practice of tracking how systems perform. That includes infrastructure components, network devices, virtual machines, and the applications that sit on top. Done well, it means real-time awareness of what’s healthy, what’s slowing down, and what’s about to break. Done right, it means fewer surprises and faster decisions.
The market for IT infrastructure monitoring hit $25.13 billion in 2024, and it’s on track to reach $34.5 billion by 2029. That growth is coming from one place: pressure. Pressure to deliver uptime across complex environments. Pressure to spot threats early. Pressure to meet SLAs without drowning in alerts.
What was once a background task is now a strategic capability. And the gap between monitoring and observability is where enterprise risk — or resilience — is won.
Why IT Monitoring Is a Strategic Priority for Enterprise Leaders
In large, distributed organisations, issues don’t stay small for long. Whether it’s a misconfigured server, a bottleneck in the performance of a mobile app, or a spike in CPU usage, the ability to detect and act before users notice is what separates high-performing IT teams from reactive ones.
This is why IT monitoring has shifted from an operational checkbox to a strategic priority. Enterprise leaders need a monitoring posture that not only sees what’s happening but also understands where it's going next.
Driving visibility across complex ecosystems
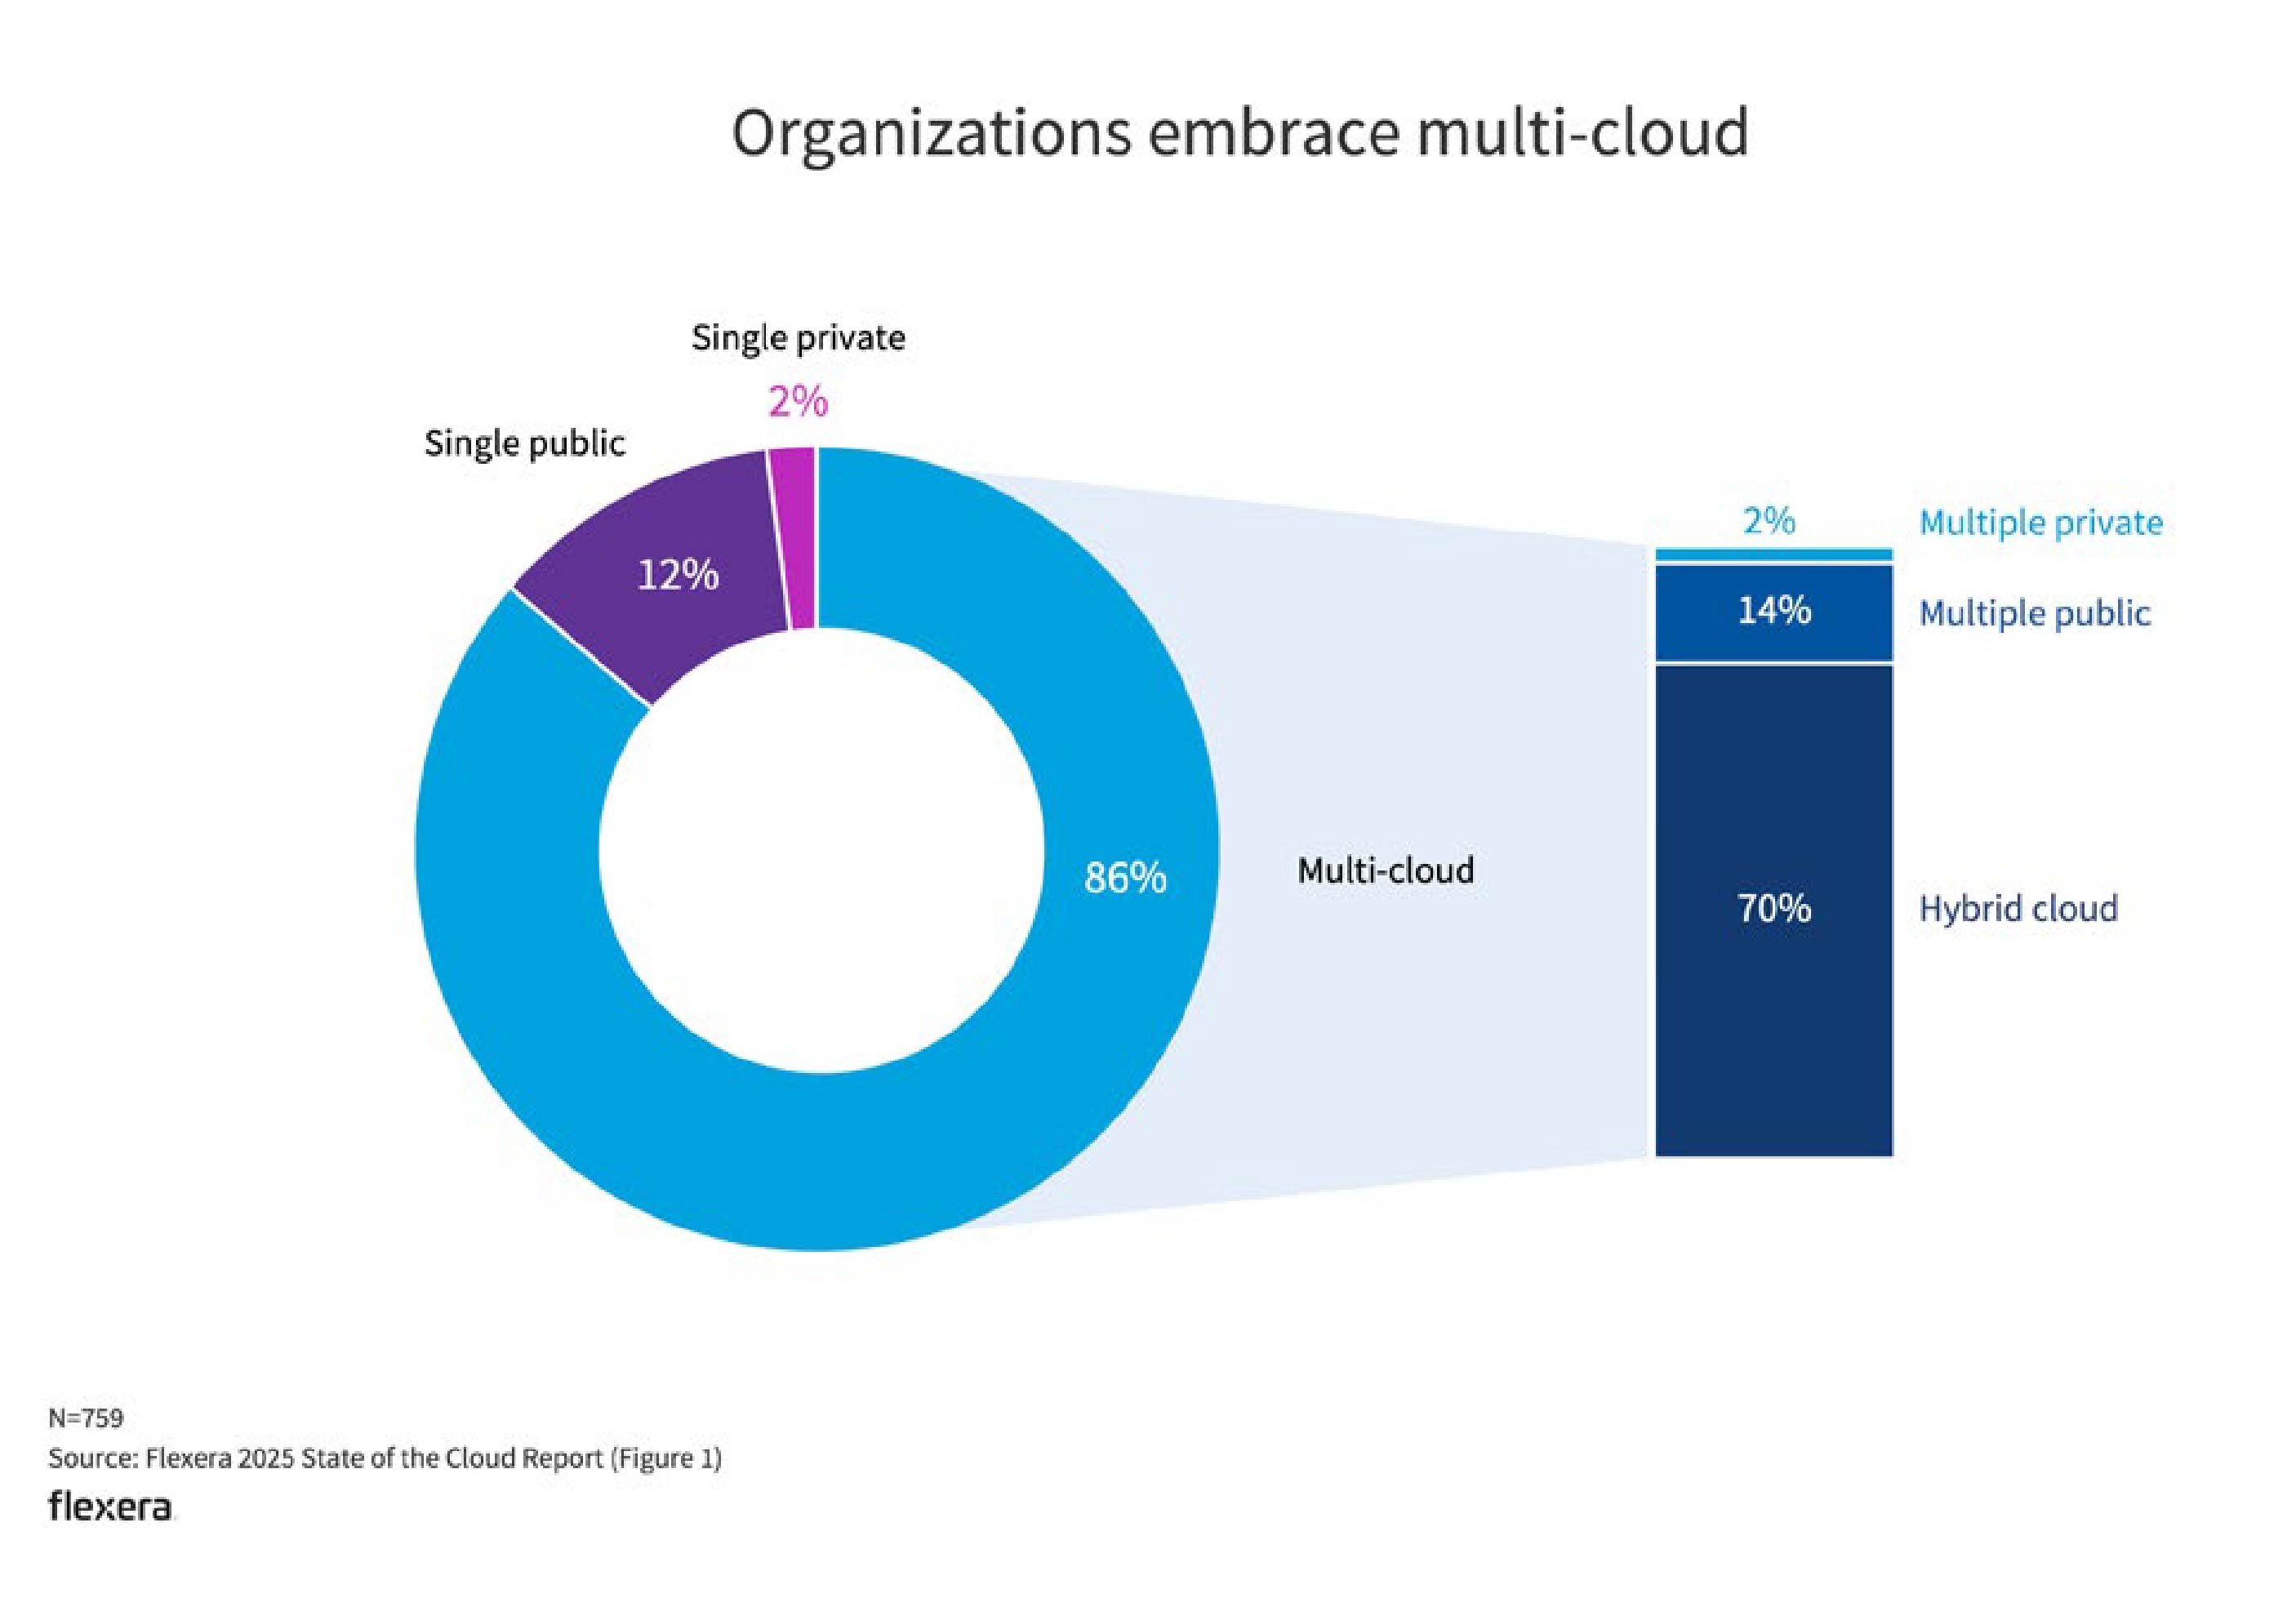
Most enterprise environments today are a blend of on-prem systems, cloud-native platforms, SaaS sprawl, and legacy tech still clinging to mission-critical workloads. According to Flexera’s 2025 State of the Cloud Report, 86 per cent of organisations now operate in hybrid environments. These typically span multiple infrastructure layers across business units, geographies, and regulatory contexts.
Without deep infrastructure monitoring and a unified view into server health and application performance, it becomes nearly impossible to manage risk or optimise delivery. Blind spots create vulnerabilities. Monitoring provides the visibility needed to move from patching symptoms to fixing systems.
Protecting performance, uptime, and customer trust
Downtime doesn’t just break workflows. It ruins customer experiences and breaks confidence. Whether the cost is financial, reputational, or both, the longer the outage, the higher the stakes.
Monitoring tools help cut through the noise. They track response times, flag health and performance bottlenecks, and send alerts when critical thresholds are breached. That means teams can move quickly, focus their efforts, and stay ahead of escalating issues. In environments where every second counts, continuous monitoring is essential to resilience, accountability, and delivering on expectations.
Enabling proactive and intelligent IT operations
The difference between reactive and proactive monitoring is the difference between fighting fires and designing systems that don’t ignite in the first place.
Reactive monitoring starts when something breaks. Proactive monitoring works earlier. It spots warning signs like rising CPU usage or creeping resource constraints. With the right setup, real-time monitoring can identify trends, trigger smart alerts, and give teams the context they need to act before incidents hit.
This shift creates more than just efficiency. It creates control. Monitoring becomes a source of clarity, helping teams prioritise action, reduce risk, and make better decisions with less guesswork.
The Core Components of an IT Monitoring System
Not all monitoring is created equal. Some tools show you what's broken. The right ones show you what’s coming and why it matters. To get there, you need more than metrics. You need a monitoring system built around the full lifecycle of visibility, analysis, and action.
Most modern setups follow a layered approach. While terminology varies between vendors, the structure typically includes three essential layers: foundation, monitoring, and interpretation.
Foundation layer – the infrastructure footprint
This is where monitoring starts: the physical and virtual assets that power your environment. That includes everything from bare metal servers and network devices to virtual machines and operating systems.
At this layer, the focus is on availability and status. Are the hosts online? Are the switches responsive? Is disc space running low? A good monitoring setup at this level tracks server uptime, confirms system health, and flags silent failures early, before they snowball into something worse.
It’s basic, but essential. Without a clear picture of your infrastructure footprint, everything above it becomes guesswork.
Monitoring layer – what your tools track
Once the infrastructure is accounted for, the next layer zeroes in on performance. This is where your monitoring software comes into play. It will collect data in real-time, telling you how applications perform and whether services are behaving as expected.
Common service checks at this layer include CPU usage, memory consumption, API response times, and service availability. For cloud-native or containerised environments, this may also include orchestration metrics, pod health, and service mesh insights.
The service layer is the operational heartbeat of your environment. It's where issues like latency, load, or resource saturation start to show up. Monitoring tools help by surfacing the signals that matter and filtering out the noise that doesn’t.
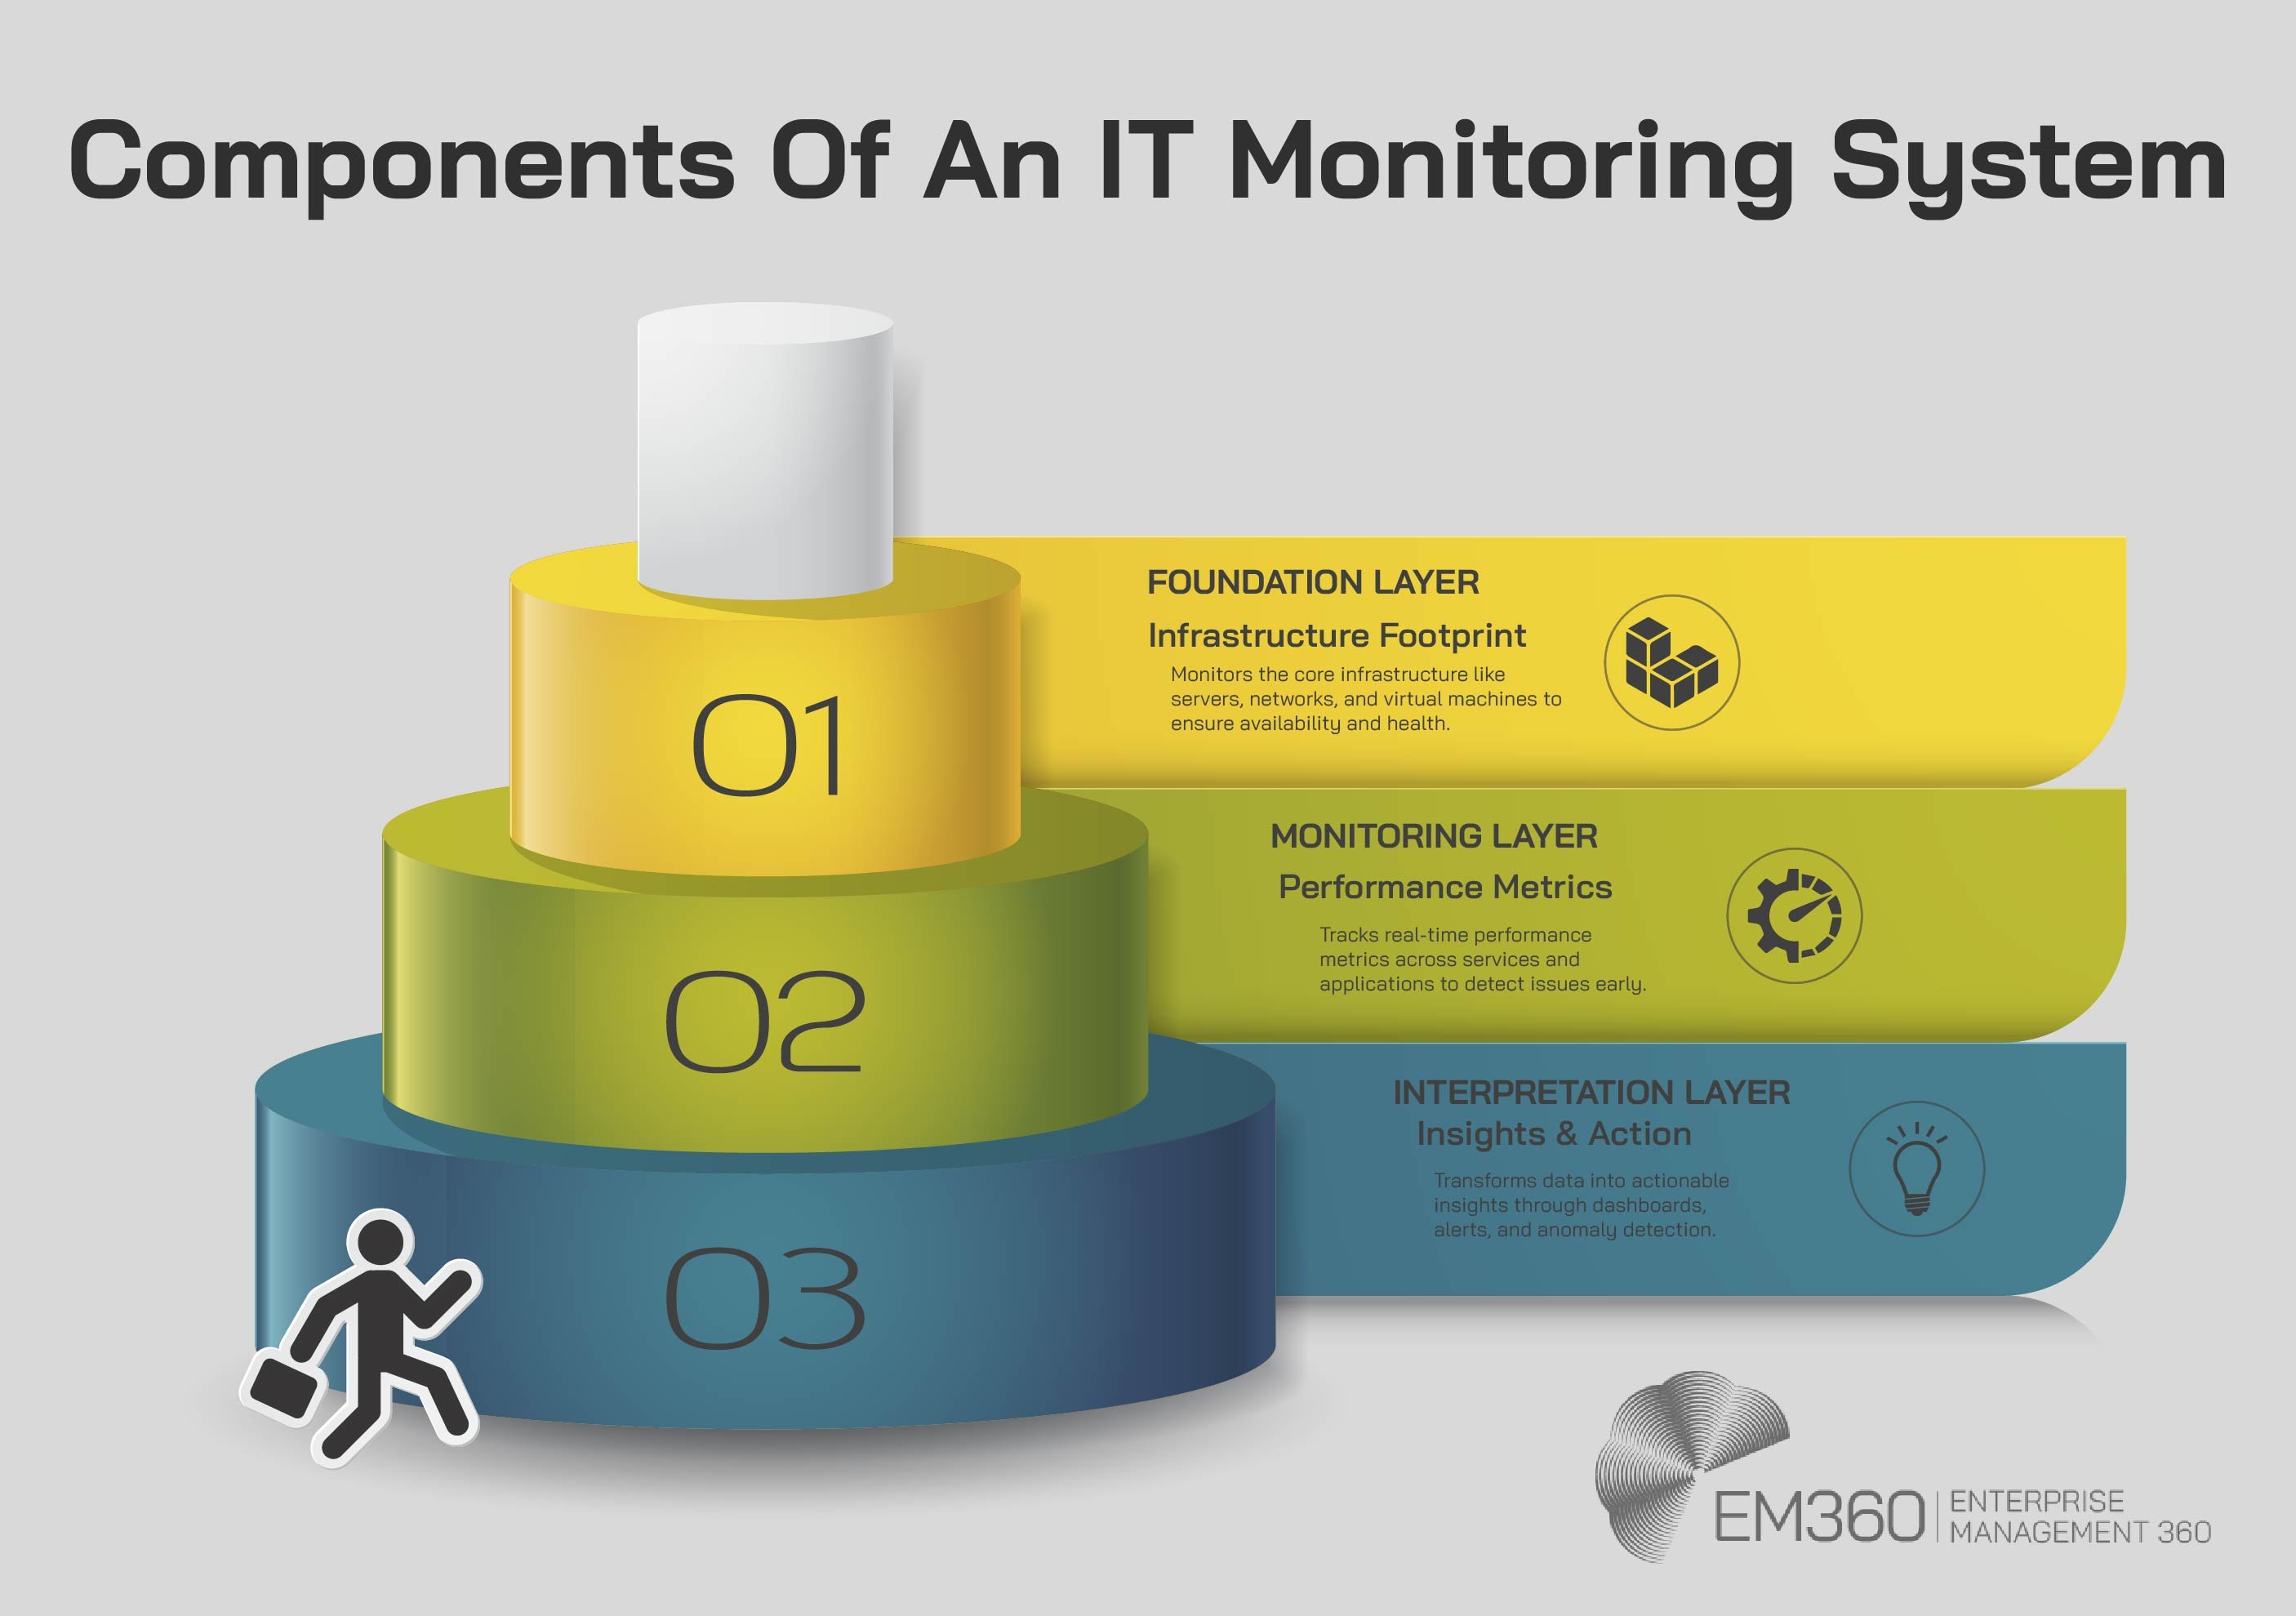
Interpretation layer – insights and action
The final layer is where raw metrics become usable intelligence. This is where teams interact with dashboards, alerts, and visualisations to understand not just what is happening but also how to respond.
The best systems don't just push out alerts. They allow you to set thresholds, correlate signals, and identify anomalies with context. Static alerts are helpful when the issue is binary. But in more complex environments, anomaly detection and adaptive baselines reduce alert fatigue while improving early detection.
At this level, monitoring becomes more than a system of record. It becomes a decision support tool that helps teams act with clarity and focus.
Types of IT Monitoring and What They Cover
Enterprise environments aren’t built on a single layer of technology, so monitoring strategies can’t be one-dimensional. From infrastructure health to cloud performance optimisation and security telemetry, each layer of the stack demands a different kind of visibility.
These are the core types of IT monitoring that enterprise teams rely on to stay ahead of risk and keep systems performing under pressure.
Infrastructure and network monitoring
Infrastructure monitoring focuses on the systems that keep the business online: servers, network devices, endpoints, and storage. It’s where uptime starts and where the early signals of larger issues often show up.
Network monitoring tracks metrics like throughput, latency, uptime, and interface errors. When configured well, it gives teams a clear view of traffic patterns and choke points across distributed systems. It also helps reduce blind spots caused by vendor overlap or shadow IT.
This category is growing fast. The global network monitoring market reached $1.5 billion in 2024 and is projected to grow at a compound annual rate of 10.2 per cent through 2033. That growth reflects a clear shift: as more infrastructure becomes virtual or decentralised, the demand for deeper, always-on visibility is only going up.
Application and performance monitoring (APM)
APM focuses on the experience layer. It tracks how applications behave in real-world conditions and whether they meet performance expectations. Key metrics include response time, error rates, transaction traces, and resource bottlenecks.
There are two key approaches:
- Real user monitoring () measures how actual users experience the system in production.
- Synthetic monitoring simulates user behaviour in controlled scenarios to detect issues before users encounter them.
Together, these techniques provide a baseline for application health and a rapid feedback loop when performance starts to drift. For teams delivering customer-facing services or complex internal tools, APM is often the first place performance issues become visible—and the most immediate path to resolution.
Cloud and hybrid monitoring
As more enterprises adopt multi-cloud strategies or operate across hybrid stacks, traditional monitoring tools often fall short. Cloud and hybrid monitoring close that gap by tracking workloads across public, private, and on-prem environments.
This includes monitoring resource consumption, latency, and availability across cloud providers, SaaS applications, and edge nodes. It also accounts for dynamic scaling, container orchestration, and vendor-specific visibility limitations.
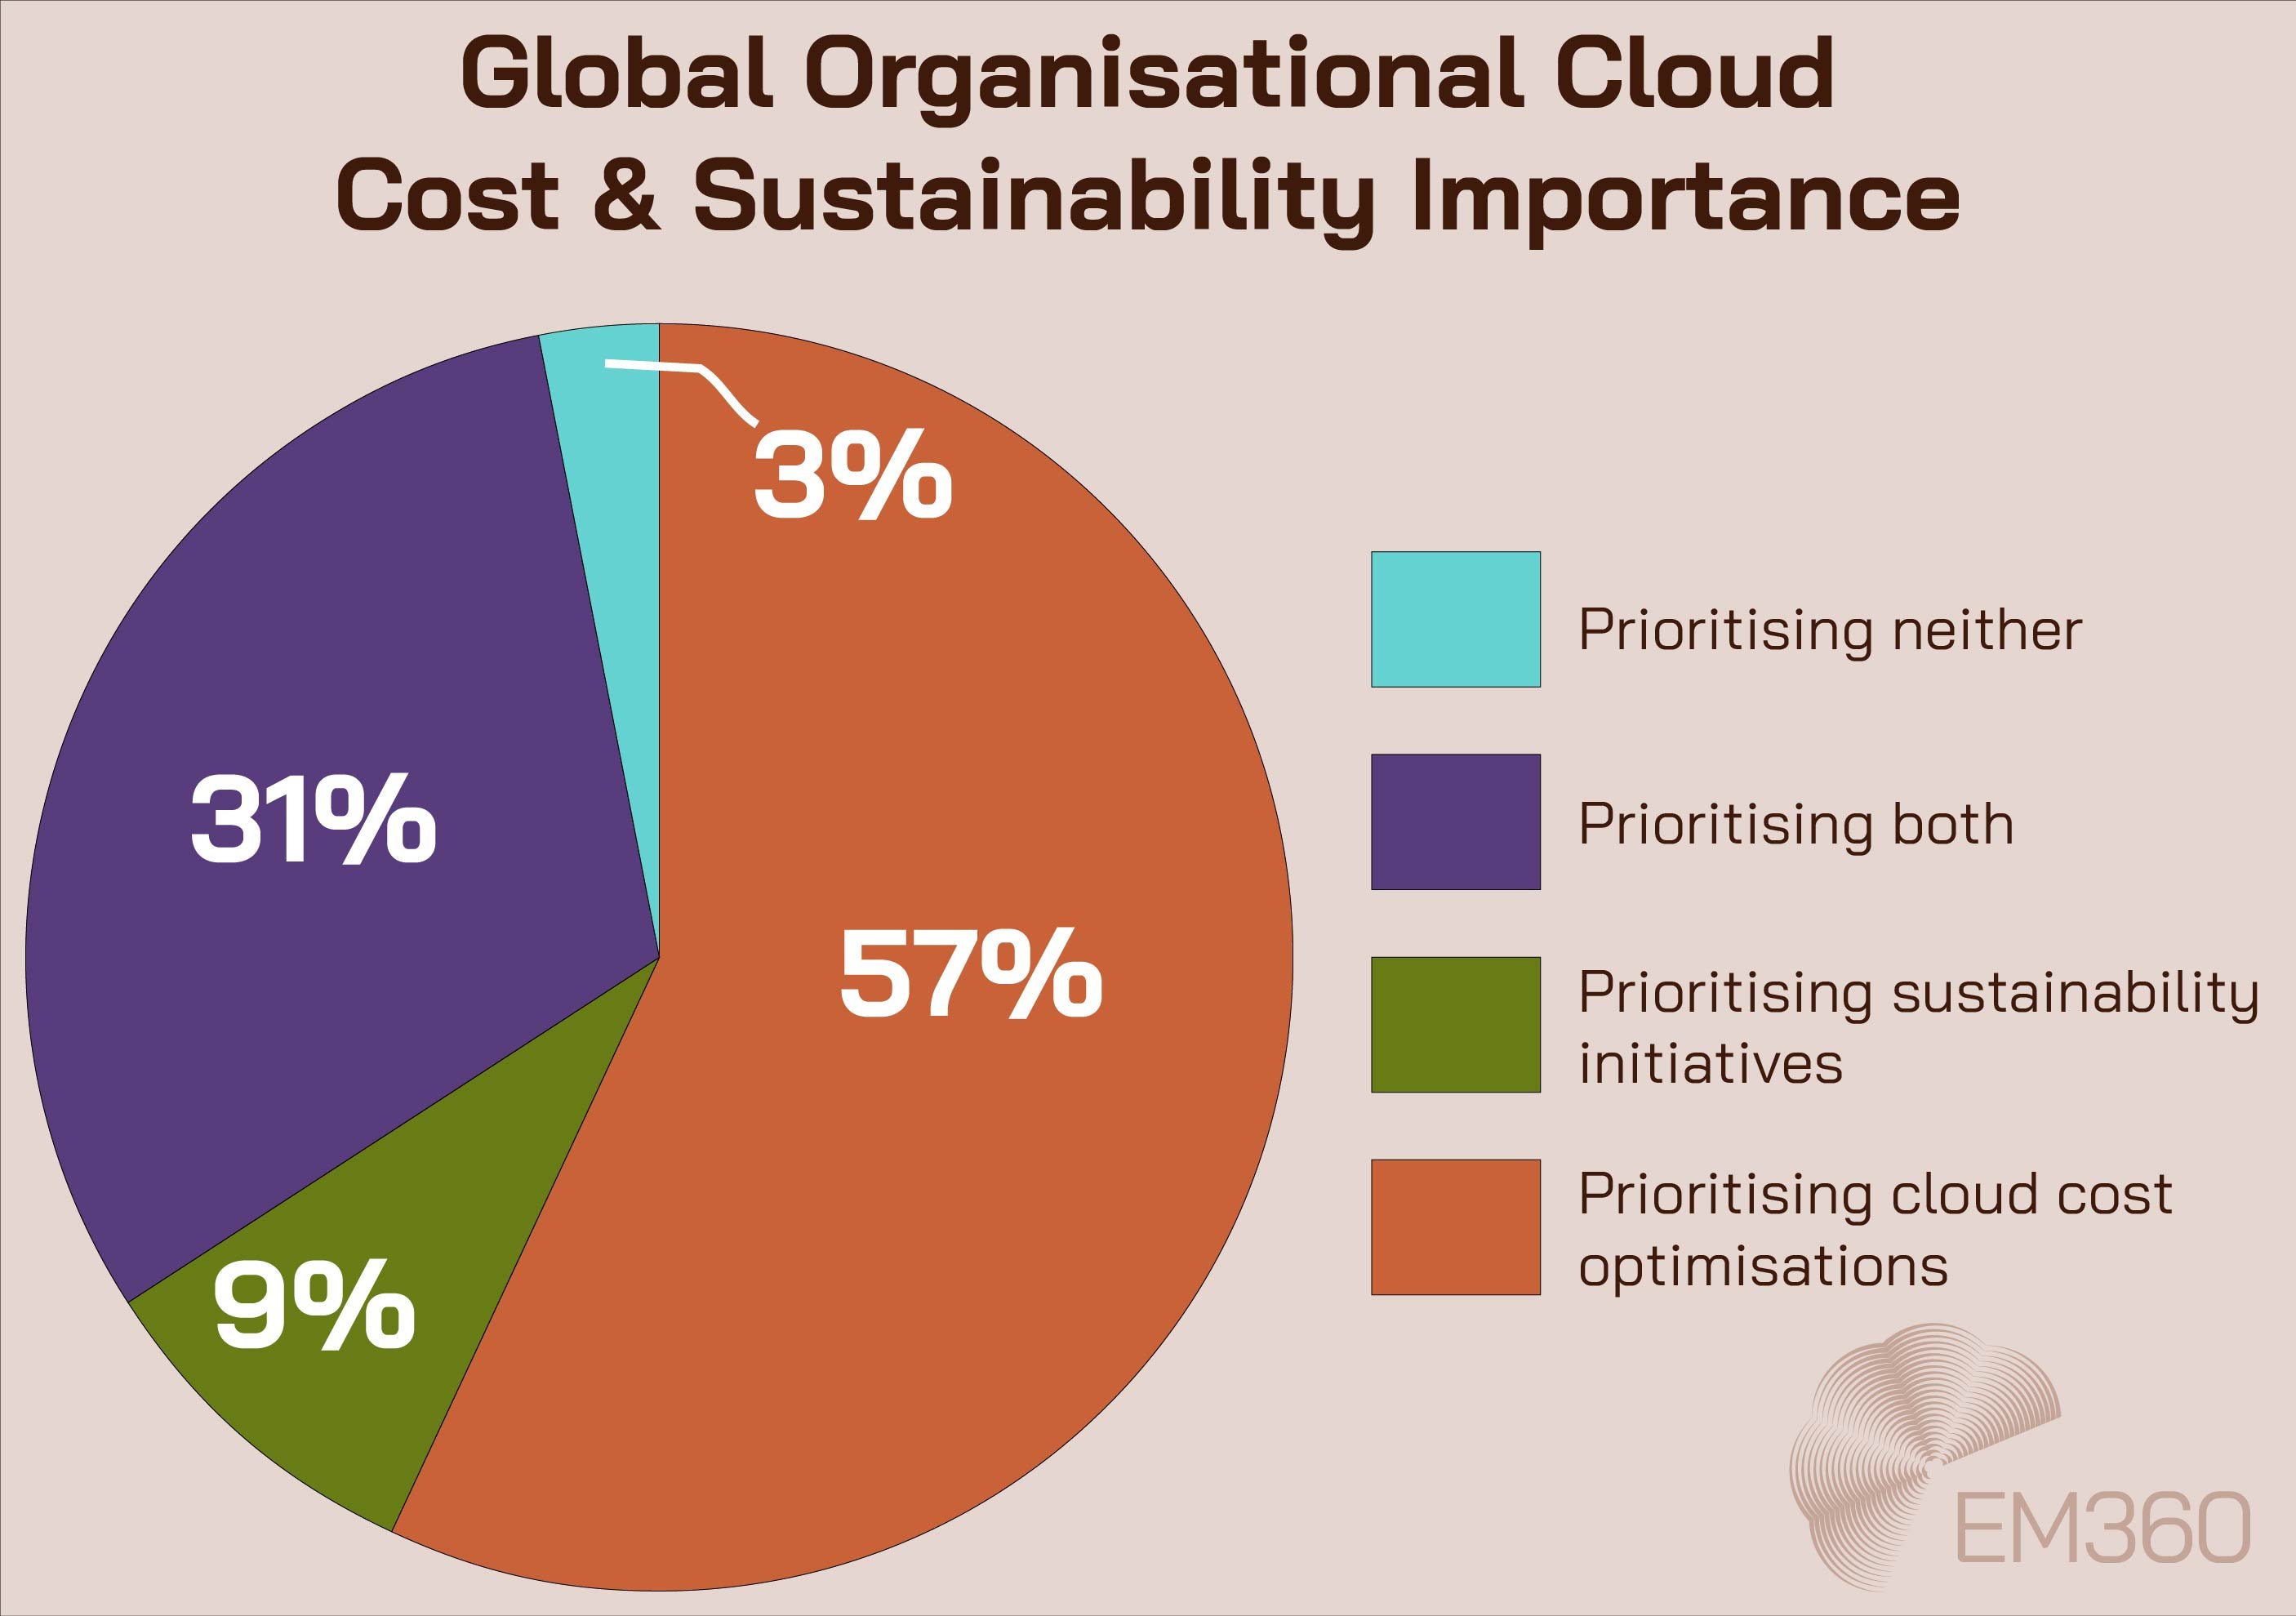
As of 2025, 57 per cent of technical professionals said their organisation was focused on optimising cloud costs, with only 9 per cent prioritising sustainability and 31 per cent weighing them both equally. Monitoring plays a central role in this optimisation strategy. The right setup brings cloud, hybrid, and on-prem environments into a single view—so performance, spend, and compliance can all be managed with greater control.
Security and compliance monitoring
Security monitoring tracks the signals that matter in today’s threat landscape. That includes event logs, access attempts, endpoint behaviours, and traffic anomalies. More advanced setups bring in threat intelligence feeds, SIEM integrations, and MDR telemetry to catch emerging risks faster.
The goal isn’t just visibility. It’s relevance. When the right alerts reach the right team at the right time, organisations can respond faster, contain threats earlier, and reduce their downstream impact.
According to Gartner, 60 per cent of enterprises will adopt managed detection and response (MDR) solutions by 2025, integrating them with their monitoring stacks. These capabilities are especially critical in regulated industries or any environment where security events need to be understood, audited, and explained to the board.
Compliance, resilience, and security culture all start with knowing what’s normal—and recognising what’s not.
Trends Shaping the Future of IT Monitoring
Monitoring is no longer just a mirror. It’s a forward-facing lens. As IT environments become more fragmented and fast-moving, traditional metrics aren’t enough. Teams need context, correlation, and the ability to act before issues become visible.
These are the trends reshaping how enterprise monitoring works, not only in tooling but in how IT leaders think about visibility, resilience, and scale.
The rise of full-stack observability
Observability doesn’t replace monitoring. It builds on it. Instead of focusing only on uptime, observability connects metrics, logs, traces, and other telemetry to provide a more complete understanding of how systems behave.
This shift matters because environments are rarely static or centralised. With cloud-native architectures, microservices, and globally distributed workloads, issues can emerge from dependencies that traditional tools often miss. Full-stack observability helps teams trace root causes across services, not just servers.
Cisco’s State of Observability 2024 report found that organisations using observability platforms reported faster incident resolution, tighter collaboration, and stronger alignment across IT and business. What emerges isn’t just fewer alerts but clearer priorities and faster fixes.
AIOps and autonomous remediation
Monitoring generates more data than most teams can reasonably process. That’s where AI-driven monitoring and AIOps add value. By applying machine learning to infrastructure and performance data, these platforms can detect anomalies, surface root causes, and trigger automated responses.
A common use case is outage prevention. Pattern analysis tools can identify behaviours that often precede failures, such as latency spikes, memory leaks, or subtle degradations in service performance. When those patterns emerge, AIOps platforms can trigger alerts, initiate remediation workflows, or escalate directly to human operators with the right context.
This shift isn’t just about efficiency. It’s about clarity. As environments grow more complex and IT teams face pressure to do more with less, intelligent automation becomes critical to maintaining control without adding manual overhead.
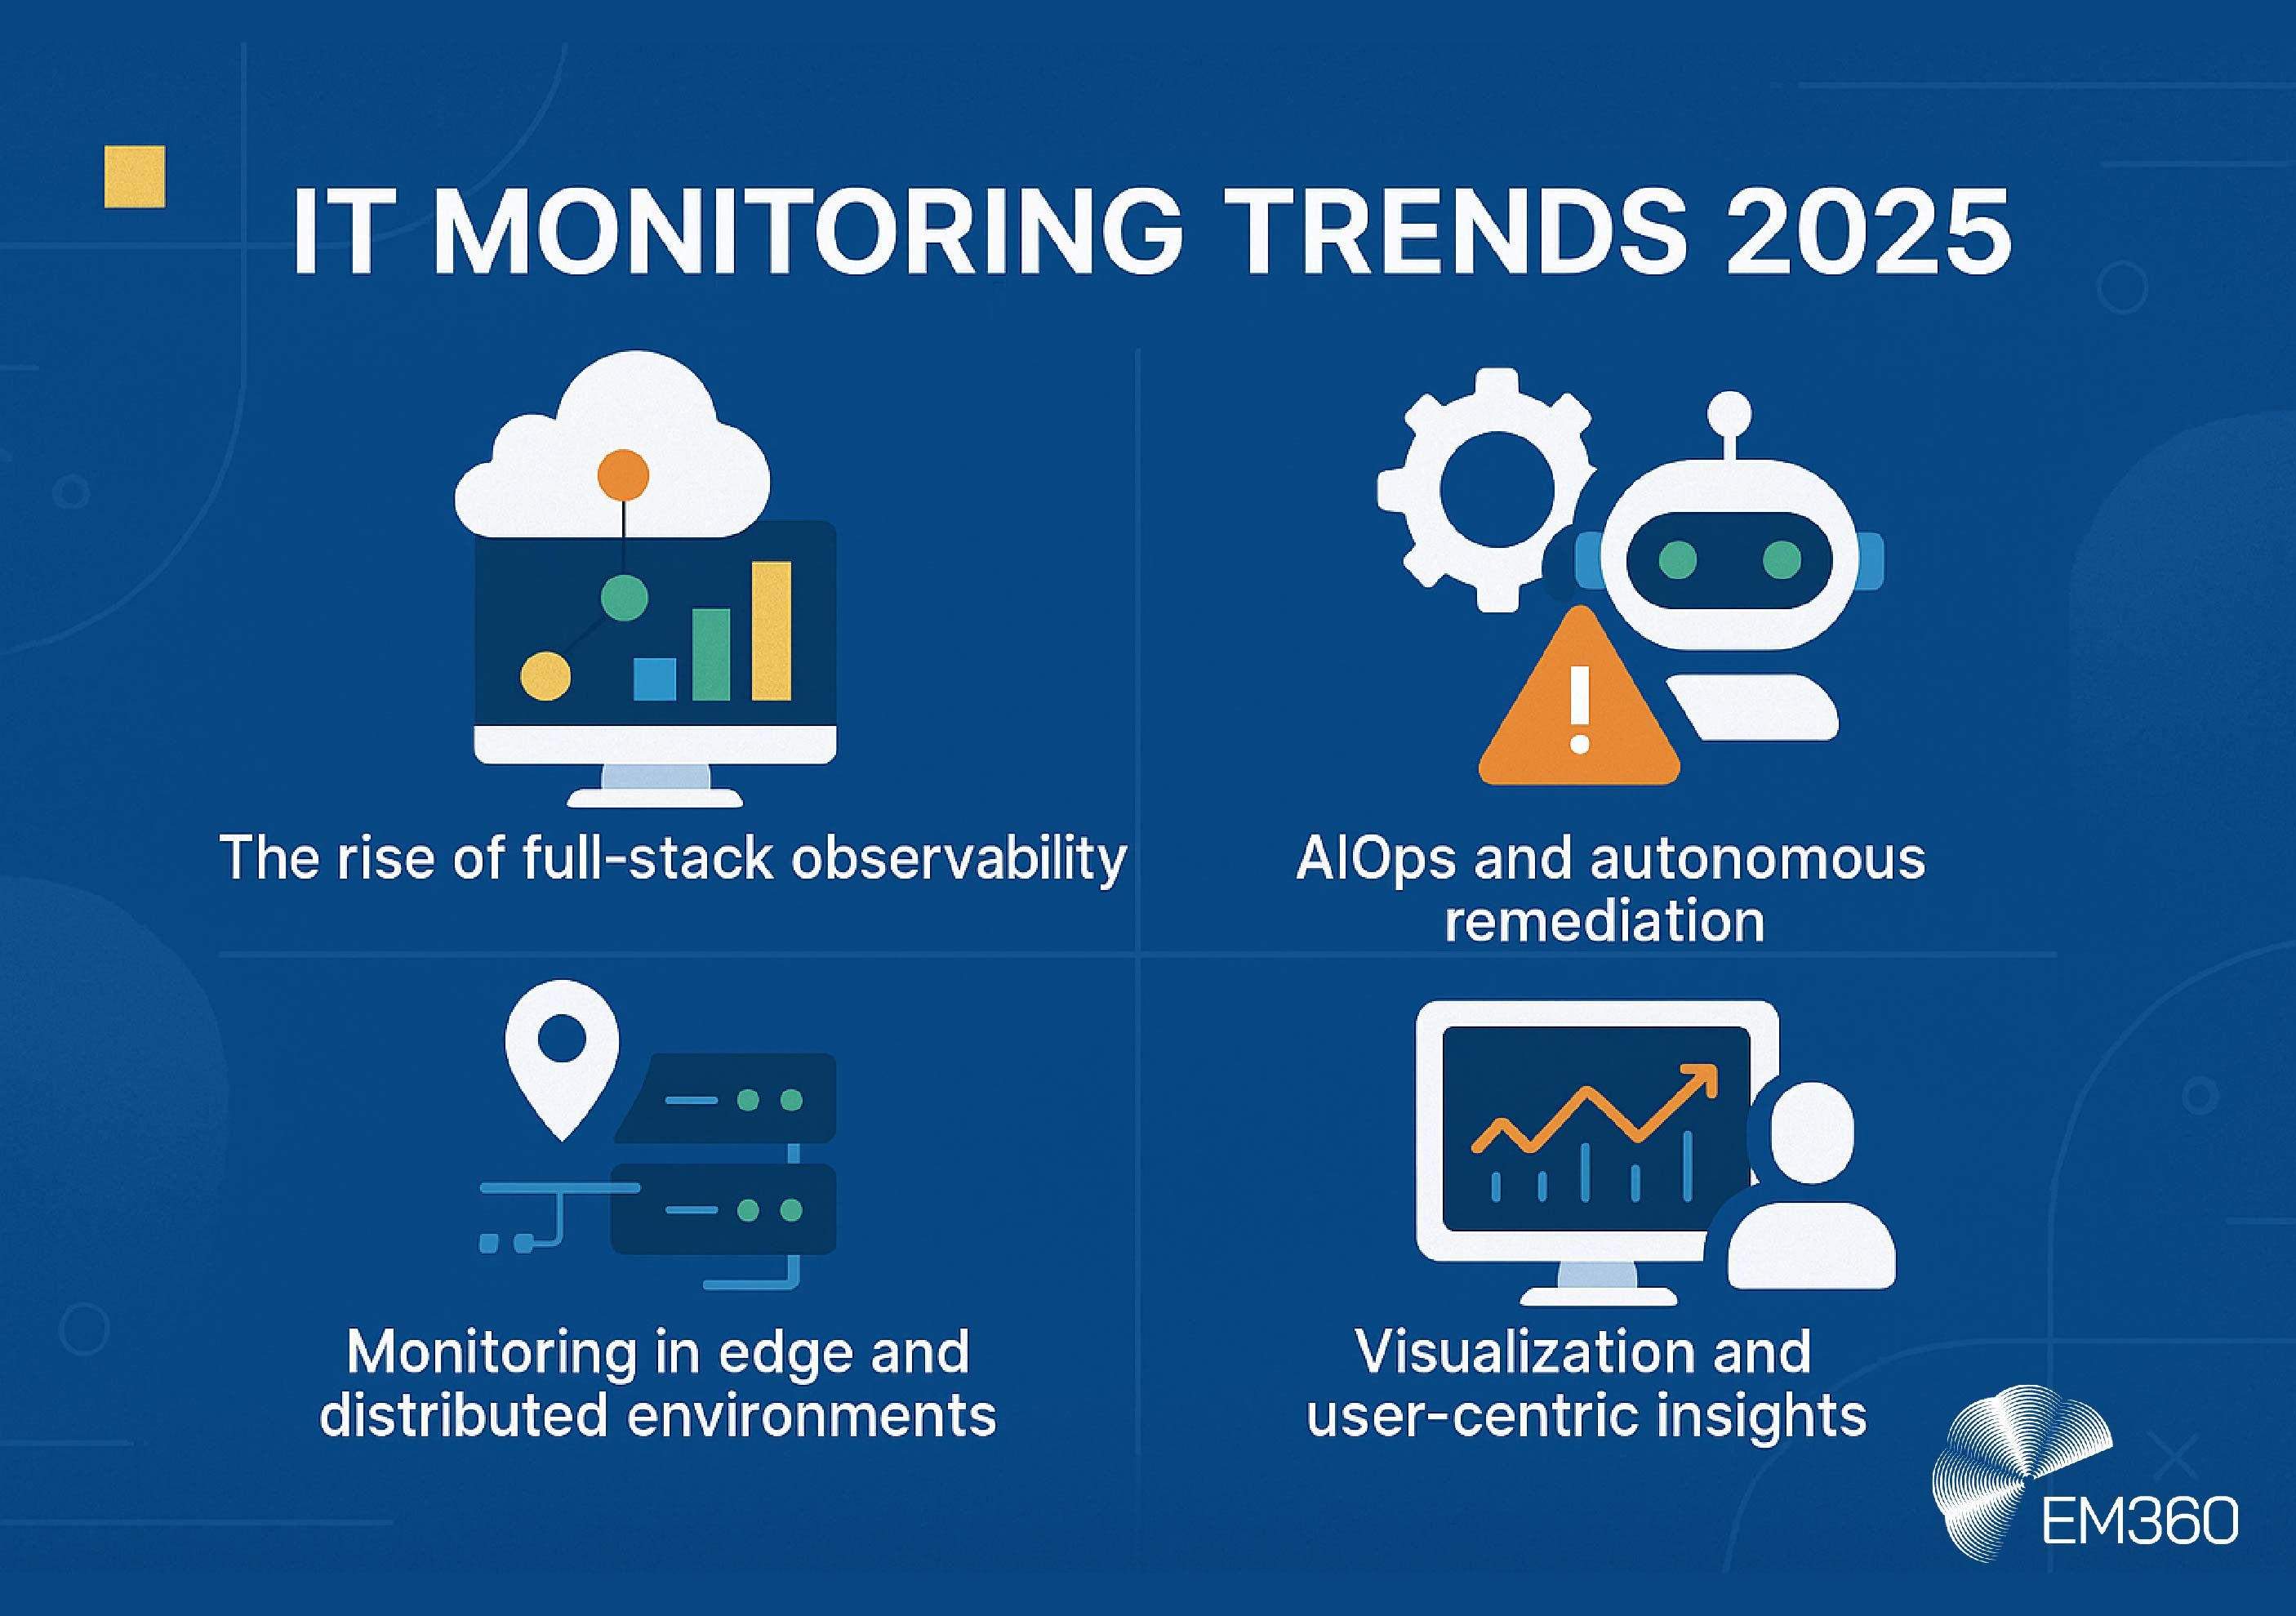
Monitoring in edge and distributed environments
The edge is not a future concept. It’s already here. From retail locations and warehouses to smart factories and field devices, edge computing is becoming part of everyday operations.
In these environments, monitoring must be fast, decentralised, and lightweight. Tools need to track remote endpoints, container performance, and orchestration status without relying on high-latency or centralised infrastructure.
If a logistics hub loses visibility into a route optimiser or a point-of-sale terminal fails during a transaction, teams need immediate context and local alerts. Edge monitoring makes that possible by bringing situational insight closer to the systems and teams that need it.
Visualisation and user-centric insights
Data doesn't drive outcomes on its own. The way insights are presented determines whether teams can act on them.
Modern monitoring platforms have shifted toward custom dashboards, real-time alert views, and performance heatmaps that reflect the needs of different teams. IT operations may need granular logs and event history. Executives want high-level summaries that support strategic decision-making. Data teams need correlation and anomaly patterns across services.
When visualisation is designed with users in mind, response times improve, cross-team communication becomes easier, and decision-making is faster and more precise.
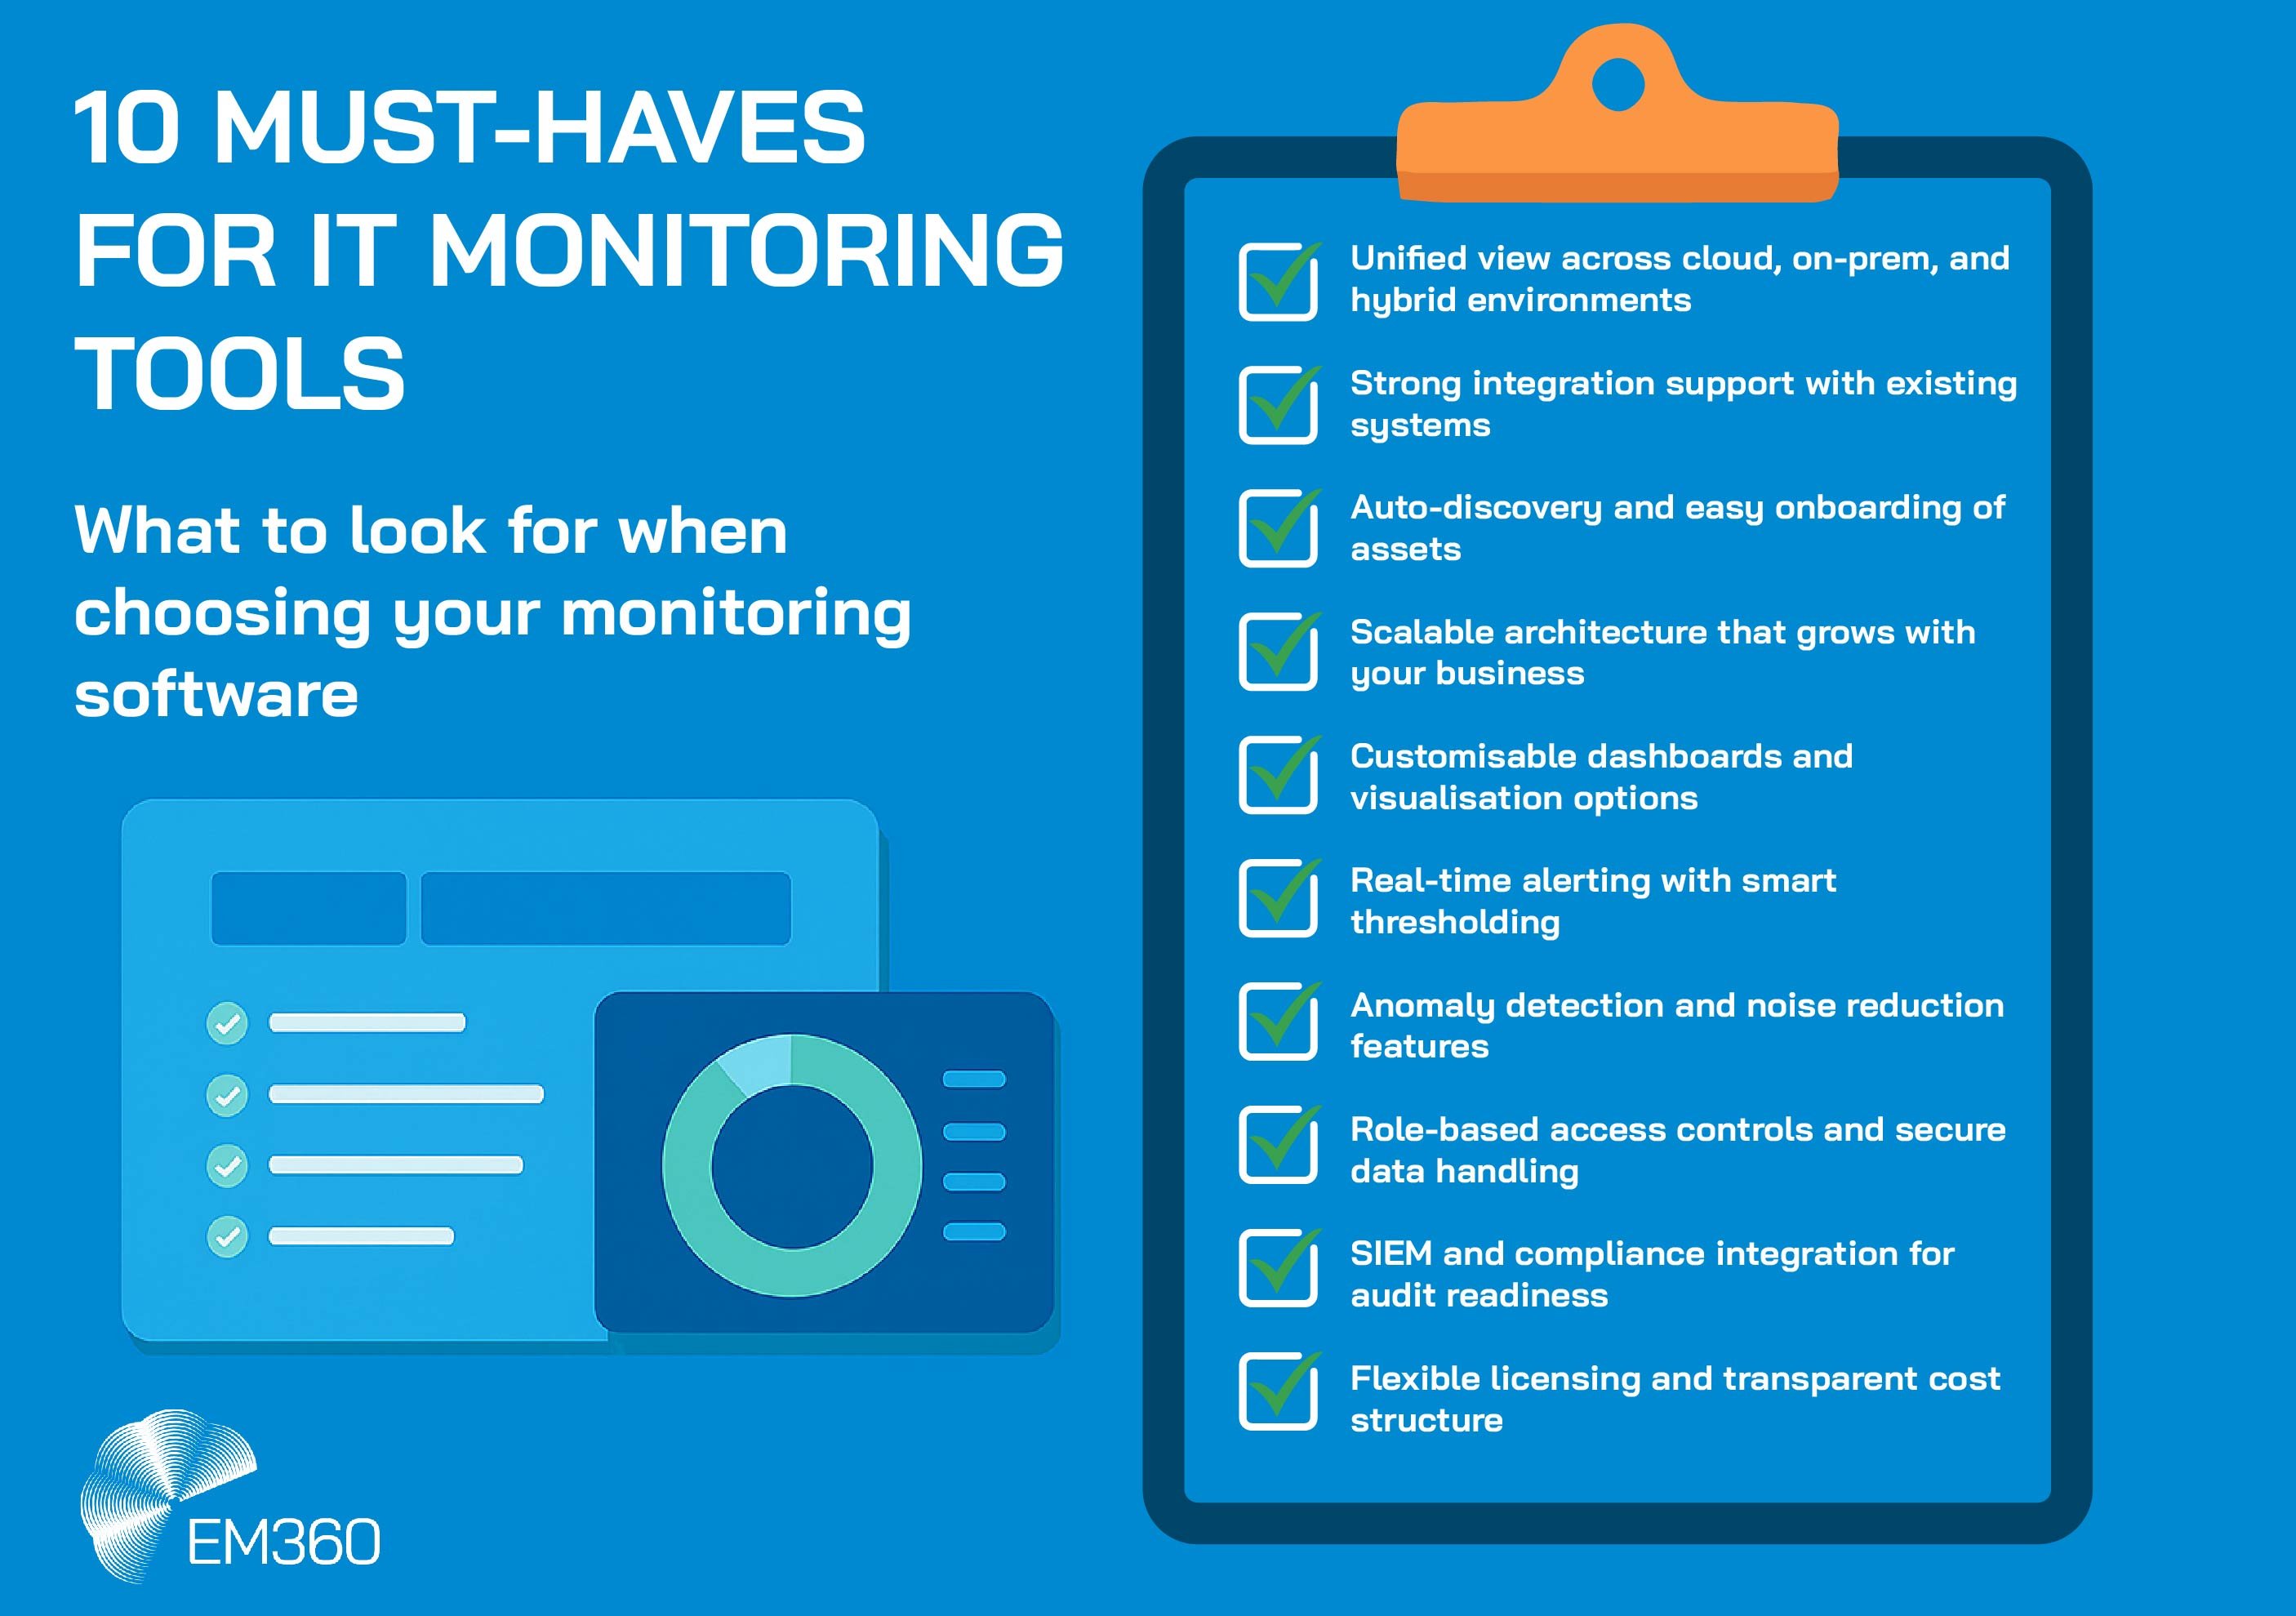
What To Look For in a Monitoring Tool
There’s no shortage of tools promising visibility, performance, and control. But finding the right fit for an enterprise environment means looking beyond surface features. It means evaluating how the tool fits with your architecture, your scale, and your operational maturity.
These are the core capabilities to prioritise when assessing modern monitoring solutions.
Unified visibility and integration
Monitoring doesn’t exist in a vacuum. The right platform should deliver a unified view across cloud and on-prem infrastructure, applications, network devices, and endpoints. That means strong integration support, native compatibility with your existing stack, and APIs that let you bring in data from wherever your systems live.
It’s not enough for a tool to collect metrics. It needs to stitch together infrastructure, services, logs, and dependencies in a way that supports real-world operations. When an incident hits, teams need answers in context—not data in isolation.
Scalability and time-to-value
A monitoring solution should scale as your business grows, not become a bottleneck in the process. That starts with auto-discovery features, pre-built templates, and deployment models that don’t require months of configuration before showing value.
If your infrastructure spans multiple clouds, hundreds of services, or dynamic orchestration layers, ask whether the platform can grow with you. Look for tools that support modular rollout, flexible agent deployment, and workload-based licensing that adapts to change.
Security, compliance, and alert management
Security is no longer a separate function. It’s embedded into the infrastructure, and your monitoring tool needs to reflect that. Look for platforms that integrate with SIEM tools, support secure monitored data flows, and offer logging features that meet audit and compliance requirements.
Alerting is another area where quality matters. A flood of irrelevant alerts creates fatigue and missed signals. The best platforms support triaged alerts, flexible thresholds, and routing rules that ensure the right teams get the right information at the right time.
A red flag to watch for is vendors who treat alerting as a fixed set of rules instead of a flexible system that adapts to your teams' workflows.
Common Monitoring Challenges (And How To Solve Them)
Monitoring should create clarity, not more complexity. But in practice, many enterprise teams find themselves buried under alerts, toggling between too many dashboards, or stuck with tools that don’t scale. These challenges aren’t new—but they’re becoming harder to ignore as infrastructure grows more distributed and the pressure for uptime intensifies.
Here’s where most teams get stuck and how to break through.
Alert fatigue and noise
When every fluctuation triggers an alert, nothing feels critical. Over-alerting leads to burnout, missed signals, and slower incident response. Even the most advanced platform becomes a liability if it can’t distinguish between noise and real risk.
The fix starts with configuration. Triaged alerts ensure that signals are prioritised and routed to the right teams. Anomaly-based thresholds go a step further by learning what normal looks like and flagging meaningful deviations instead of static rule breaches. Correlation logic can also group related events together, giving operators fewer—but more actionable—alerts.
The goal isn’t to suppress noise. It’s to surface what matters and act on it in time.
Tool sprawl and visibility gaps
Many organisations layer new tools onto old ones without fully retiring anything. The result is fragmented views, duplicate alerts, and overlapping dashboards that slow down root cause analysis.
According to industry research, 70 per cent of organisations currently use four or more monitoring tools across their stacks. In theory, more tools should mean more coverage. In reality, they often create silos, integration overhead, and conflicting data.
Consolidation doesn’t mean settling for one tool that does everything. It means choosing platforms with broad integration support, flexible data ingestion, and strong APIs—so you can centralise real time insights without forcing artificial standardisation.
Skills shortages and dashboard overload
Even the best monitoring platform needs people who know how to use it. But enterprise IT teams are already stretched thin, and many are grappling with skills gaps in cloud architecture, observability, and automation.
At the same time, dashboard overload makes it hard to know where to look. Having dozens of graphs and widgets isn't helpful if they don't clearly show you what steps to take next.
The solution is not more dashboards—it’s smarter ones. Look for platforms that automate insights, not just alerting. Features like preconfigured health summaries, guided diagnostics, and contextual recommendations can help less experienced teams take confident action without relying on tribal knowledge or constant escalation.
Top Tools for Enterprise IT Monitoring
There’s no one-size-fits-all when it comes to monitoring. Some tools excel at infrastructure health, others at application performance or log analysis. The right choice depends on your architecture, scale, budget, and internal capability.
Here’s a snapshot of the leading monitoring tools, with a focus on real enterprise use cases—not just feature parity.
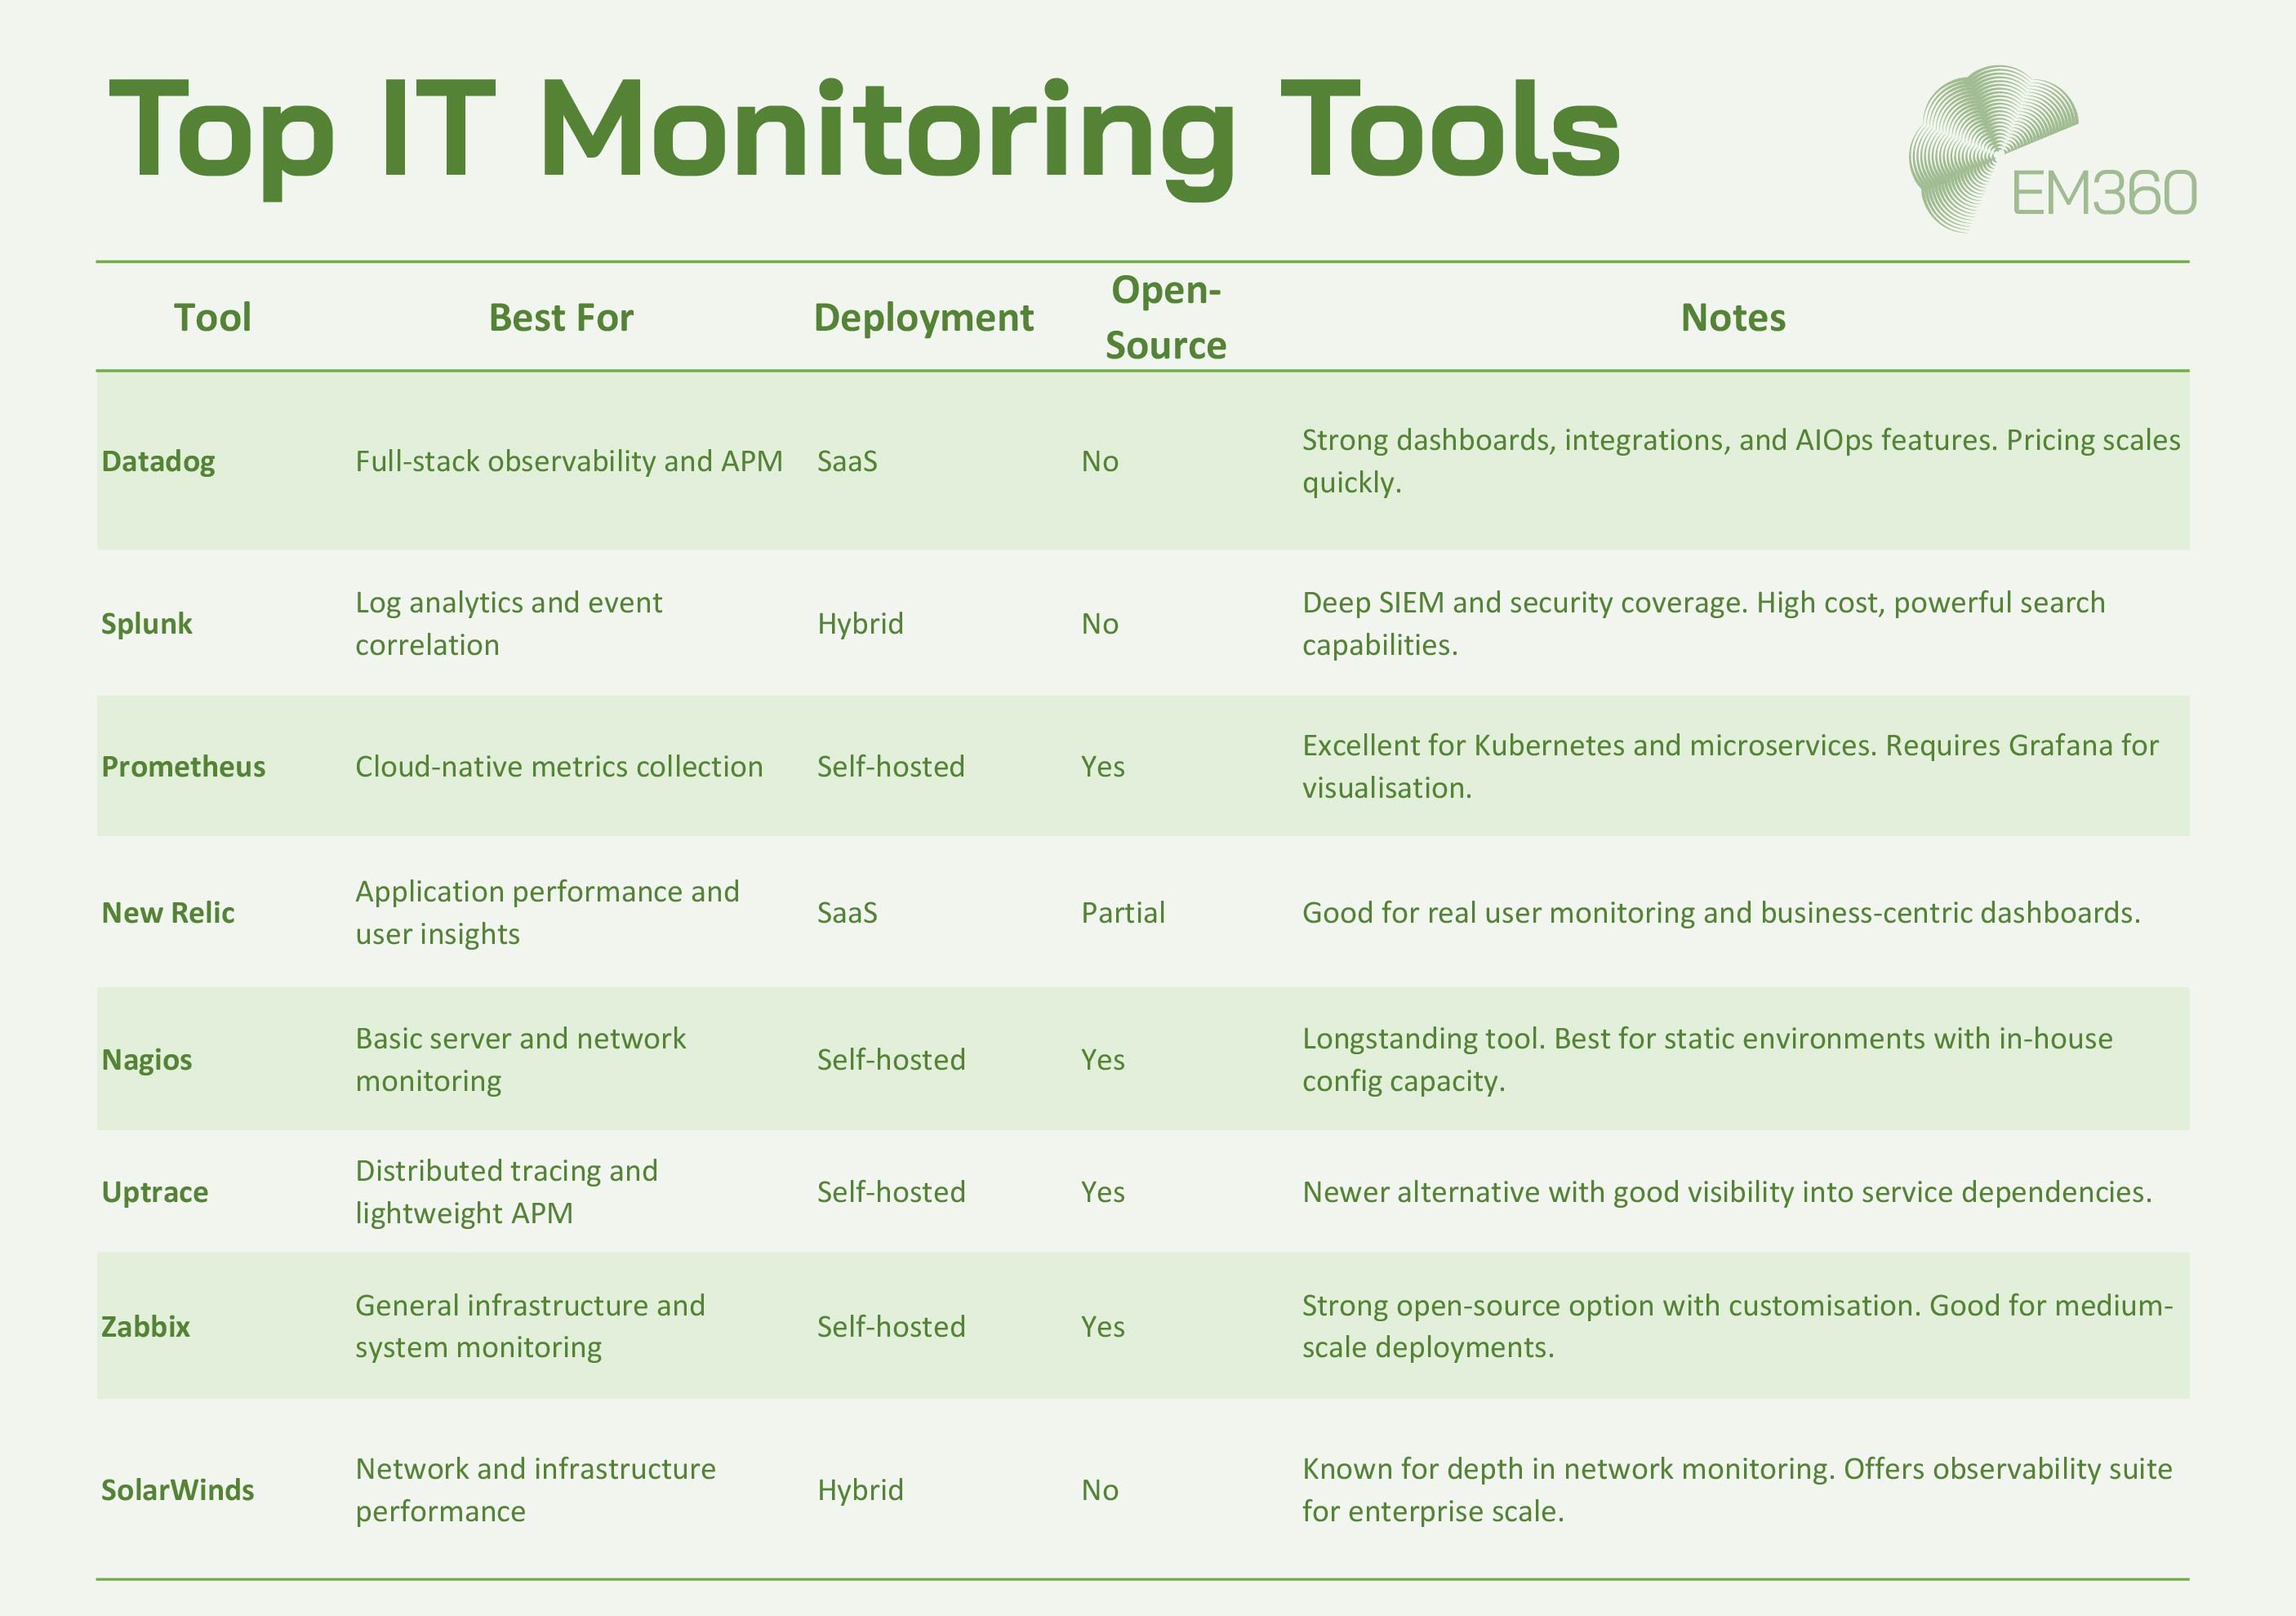
A note on open-source vs. commercial platforms
Open-source tools like Prometheus, Zabbix, and Nagios give teams full control over configuration and data privacy. They can be more cost-effective, but they often require internal expertise to deploy, maintain, and scale.
Commercial solutions like Datadog, Splunk, and New Relic offer faster time-to-value, richer support, and built-in integrations but can become expensive as environments scale. They're often best suited for organisations that prioritise speed and flexibility over granular control.
The right choice depends on what you're optimising for—cost, complexity, scalability, or all of the above.
Final Thoughts: Monitoring is a Strategic Capability
IT monitoring isn’t just about keeping systems online. It’s how enterprise leaders protect performance, reduce risk, and make informed decisions at scale. When it's set up to deliver the right insights to the right people at the right time, monitoring becomes more than a technical tool. It becomes a strategic asset.
The ability to see what’s happening—and understand what to do about it—has never been more important. For everything from hybrid infrastructure to security operations and end-user experience. The stakes aren’t just technical. They’re operational, financial, and reputational.
The smartest organisations are moving beyond reactive checks and point solutions. They’re building monitoring into the foundation of their resilience strategy.
To explore more insights on building high-impact IT systems, tools, and teams, visit EM360Tech.


Comments ( 0 )